
Truvyx operating manual · single source of truth
Use Truvyx from your first product connection to continuous quality control.
This is the beginner-friendly, end-to-end path through the live platform. Follow it in order the first time. Later, use the section navigation to return to the exact screen you need.
The complete operating loop
Create an organisation → create a product and environment → choose a connection → create a scenario → define constraints → map the decomposition → generate a verifier → submit and review a run → diagnose failures → create remediation and regression coverage → monitor future behaviour → compare human outcomes and cost → reuse approved assets.
Create the product you are evaluating
Products & Connections is the starting record for an AI system. It gives every later scenario, run, trace, alert, cost record, and investigation an unambiguous product and environment.
Before you write a test, create the AI system that will be tested. A product is not a billing item and it is not your entire company. It is one AI capability with a clear operating context, such as a claims-triage assistant, a support copilot, or a multi-agent research workflow.
The environment matters just as much as the name. Development, staging, and production can legitimately produce different behaviour. Recording the environment prevents a staging experiment from being read later as production evidence. Use the deployment identifier or Git SHA whenever you have one, so a future failure can be tied to the version that caused it.
Do this on the screen
- 1Open Products & Connections
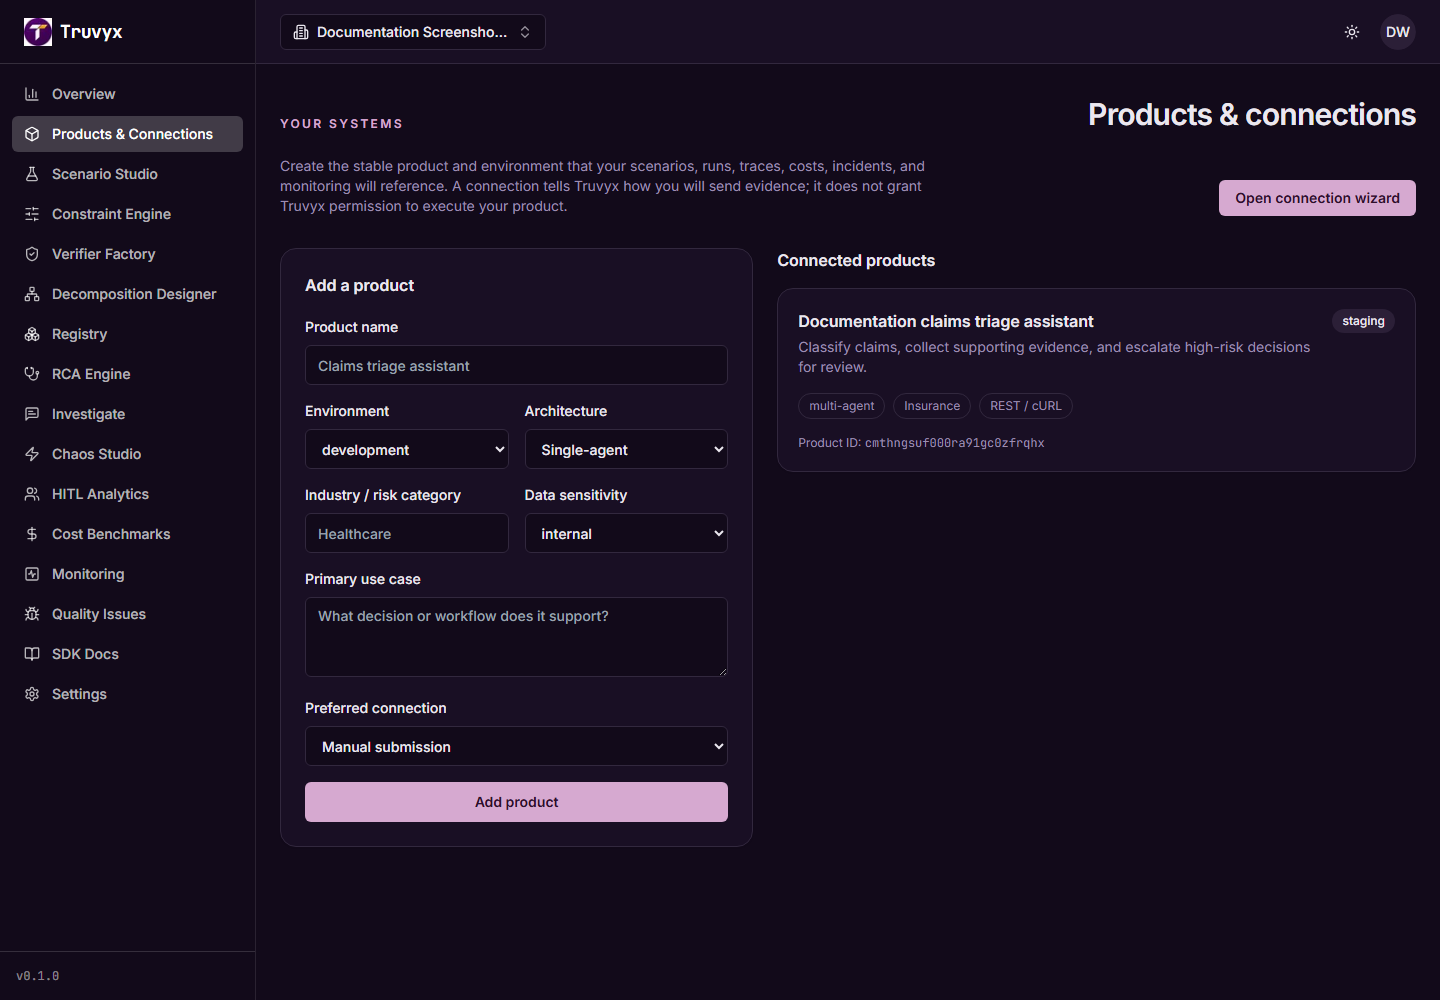
Choose Products & Connections in the sidebar. The left-hand form creates the stable product record; the right-hand panel becomes your catalogue of connected systems.
- 2Describe the system
Enter a plain, recognisable product name. Choose development, staging, or production; select the architecture that best fits the system; then state its industry, sensitivity, and primary decision or workflow.
- 3Choose the preferred pathway
This is only the team’s intended connection method. It does not give Truvyx permission to call or run your product. You can add more than one connection later.
- 4Save and check the card
After Add product, confirm that the product card shows the environment, architecture, industry, connection choice, and product ID. Use that product ID in API or telemetry integrations when required.
What comes next: Continue to the Connection Wizard. A product tells Truvyx what is being evaluated; a connection tells it how evidence arrives.
Choose and verify a connection pathway
The Connection Wizard gives a new team one place to choose how it will send evaluation evidence without confusing telemetry with permission to execute its product.
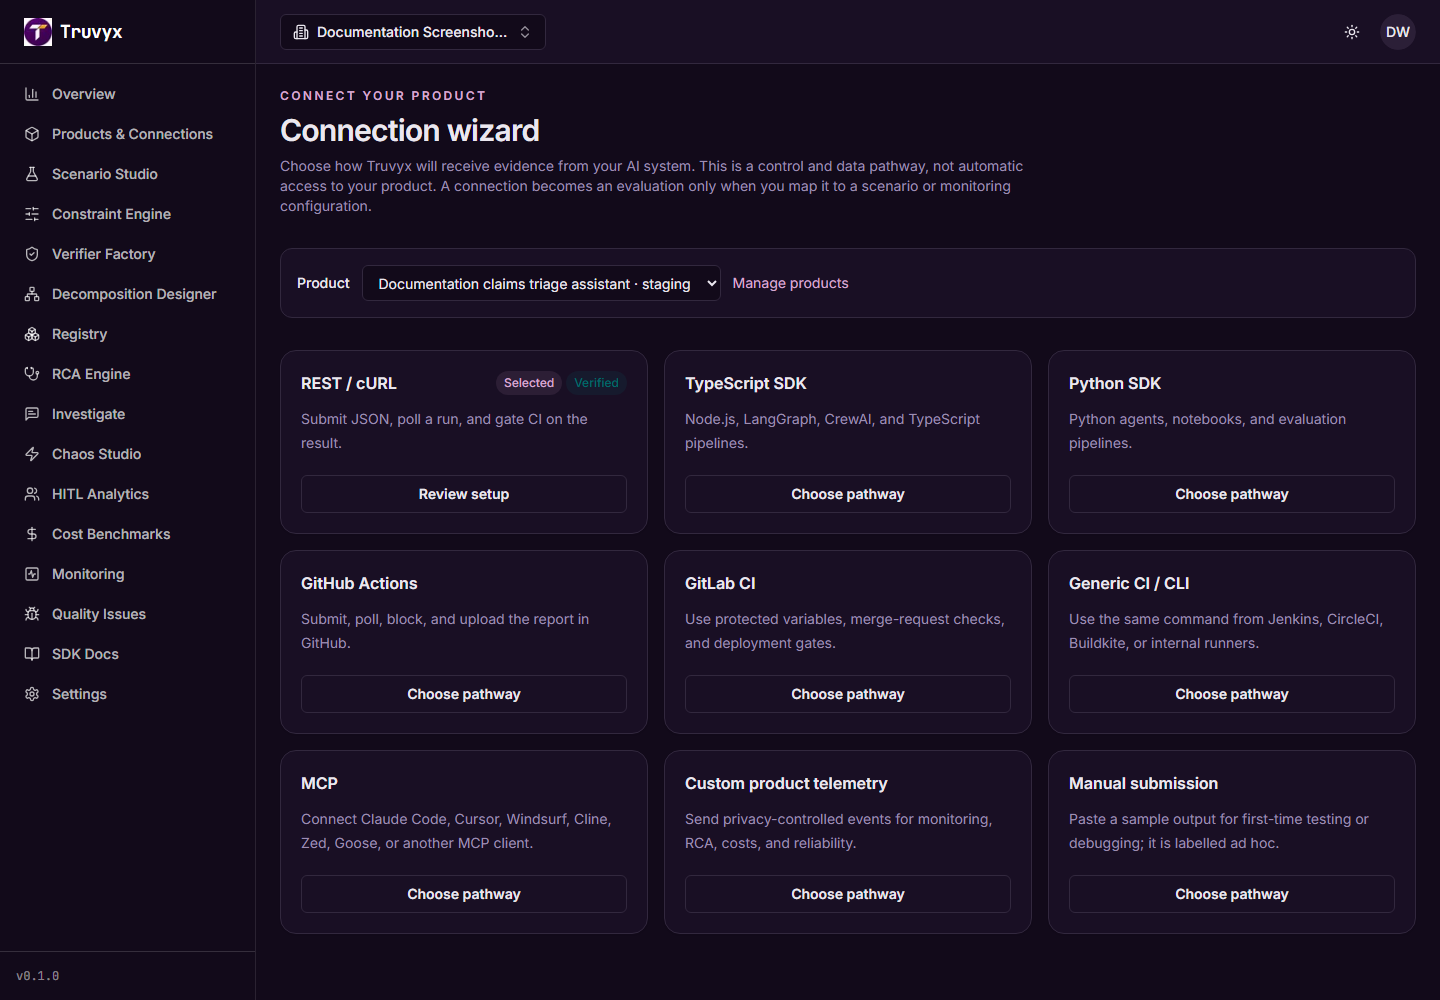
Select the product you just created, then choose the pathway that matches where your AI system already lives. REST/cURL is the broadest option. The TypeScript and Python SDKs suit application code and notebooks. GitHub Actions, GitLab CI, and generic CLI support release gates. MCP is for coding agents. Custom telemetry is for observed production behaviour. Manual submission is useful for the first example or a debugging session.
Choosing a pathway records intent and opens a setup panel. It does not prove the connection works. Complete the setup in your own system, send a safe test request, then use Mark setup verified only when you have received and inspected the expected response. Telemetry is unscored until you explicitly map it to a scenario or monitoring configuration.
Do this on the screen
- 1Select the product and environment
The selector at the top prevents a connection from being attached to the wrong system. If the product is absent, return to Products & Connections first.
- 2Choose one connection card
Read the short use case beneath each card. Choose pathway saves the method and opens its instructions. You can repeat this for a second pathway, for example REST for CI and MCP for developers.
- 3Store secrets outside Truvyx
Put a trk_ API key in your CI secret store, environment manager, or MCP client configuration. Do not paste a long-lived key into source code, tickets, or a browser screenshot.
- 4Verify the setup
Run the displayed sample in a non-production-safe test first. Marking a pathway verified is operational metadata; the real proof is a resulting run, telemetry event, or authenticated MCP tool call.
What comes next: With a product and pathway in place, define the question you want Truvyx to answer by creating a scenario.
Understand the workspace before you test
Overview is the organisation-level control room. It does not replace the module screens; it tells you where attention is needed across them.
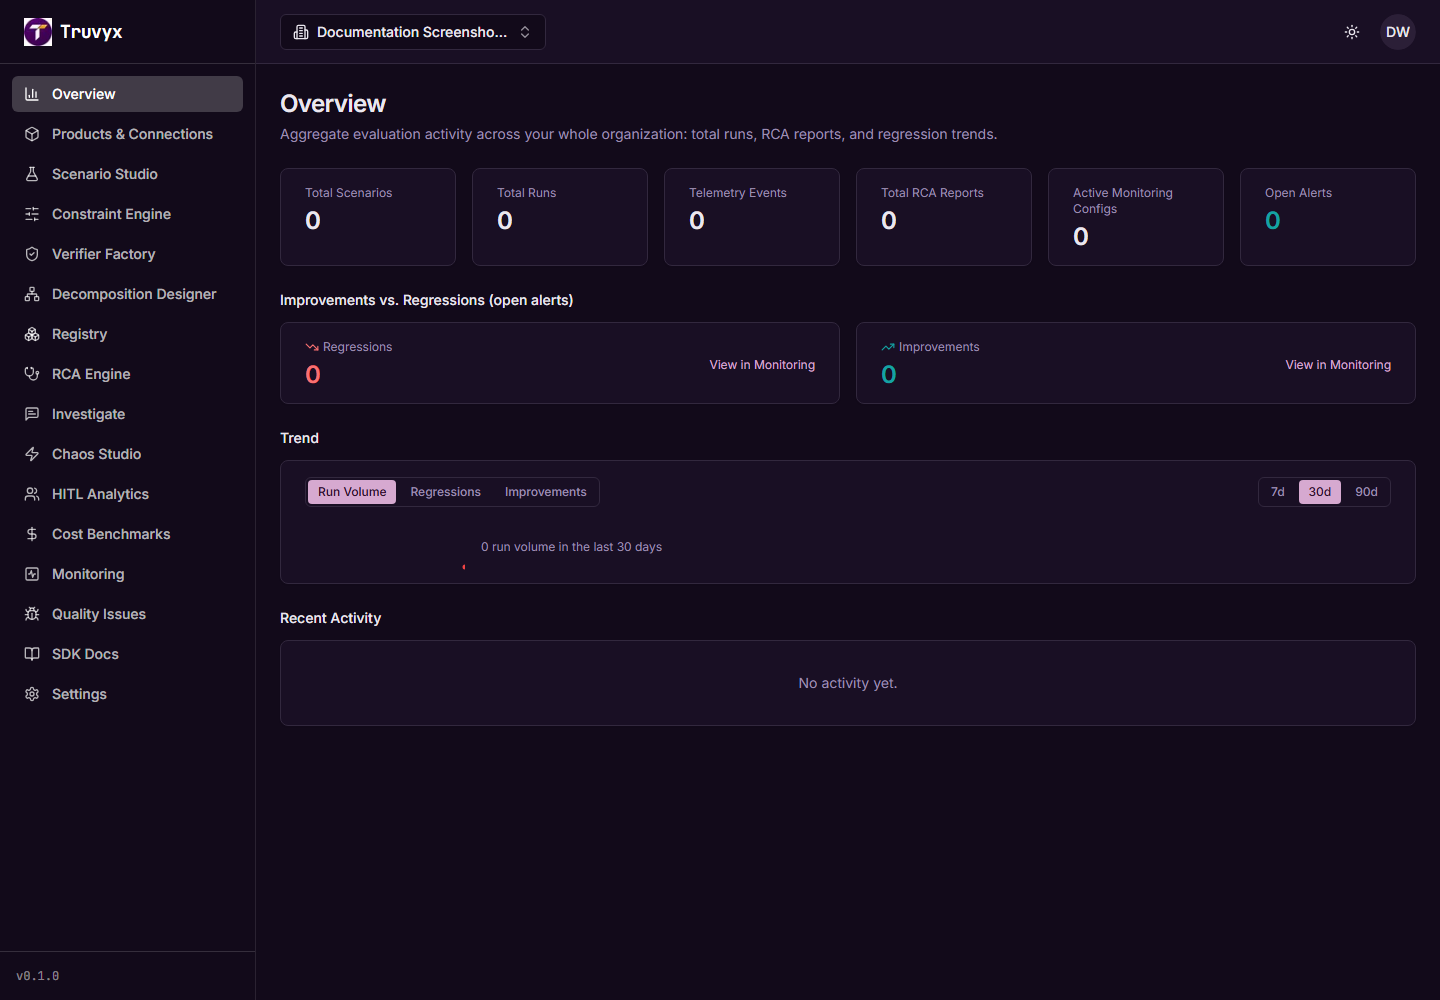
At the beginning, an empty or sparse Overview is normal. It becomes useful after you create scenarios, submit runs, send approved telemetry, configure monitoring, and create RCA reports. Its tiles deliberately count different things: an evaluation run is not a telemetry event, and an open alert is not an RCA diagnosis.
Use the trend selector to ask one question at a time. A falling pass rate suggests a quality regression. A rising telemetry count with no evaluations may mean events are arriving but have not been mapped to a monitoring rule. The recent-activity list links back to the source record so you can inspect evidence instead of acting on a summary alone.
Do this on the screen
- 1Read the tiles as separate signals
Total Scenarios describes coverage; Total Runs describes completed evaluation activity; Telemetry Events describes received operational metadata; RCA Reports and Open Alerts show response workload.
- 2Use the trend deliberately
Choose a metric and time range, then follow an unexpected movement into Monitoring or a specific run. Do not treat a small sample as a production trend.
- 3Use activity as a trail
Click a run, RCA report, or alert from Recent Activity to see the actual scenario, evidence, and timestamps behind the summary.
What comes next: The overview will fill in as you work. Now create the reusable scenario that defines what good behaviour means.
Create your first evaluation scenario
Scenario Studio turns one real product decision into a reusable, versioned test. It is the central object used by verifiers, runs, monitoring, RCA, cost analysis, and registry records.
A good first scenario is narrow. Instead of ‘evaluate our support bot,’ use a decision with a consequence: ‘decide whether a claims case can proceed, must be escalated, or needs more evidence.’ Name the agents involved, the information they may use, what they should produce, and what must never happen.
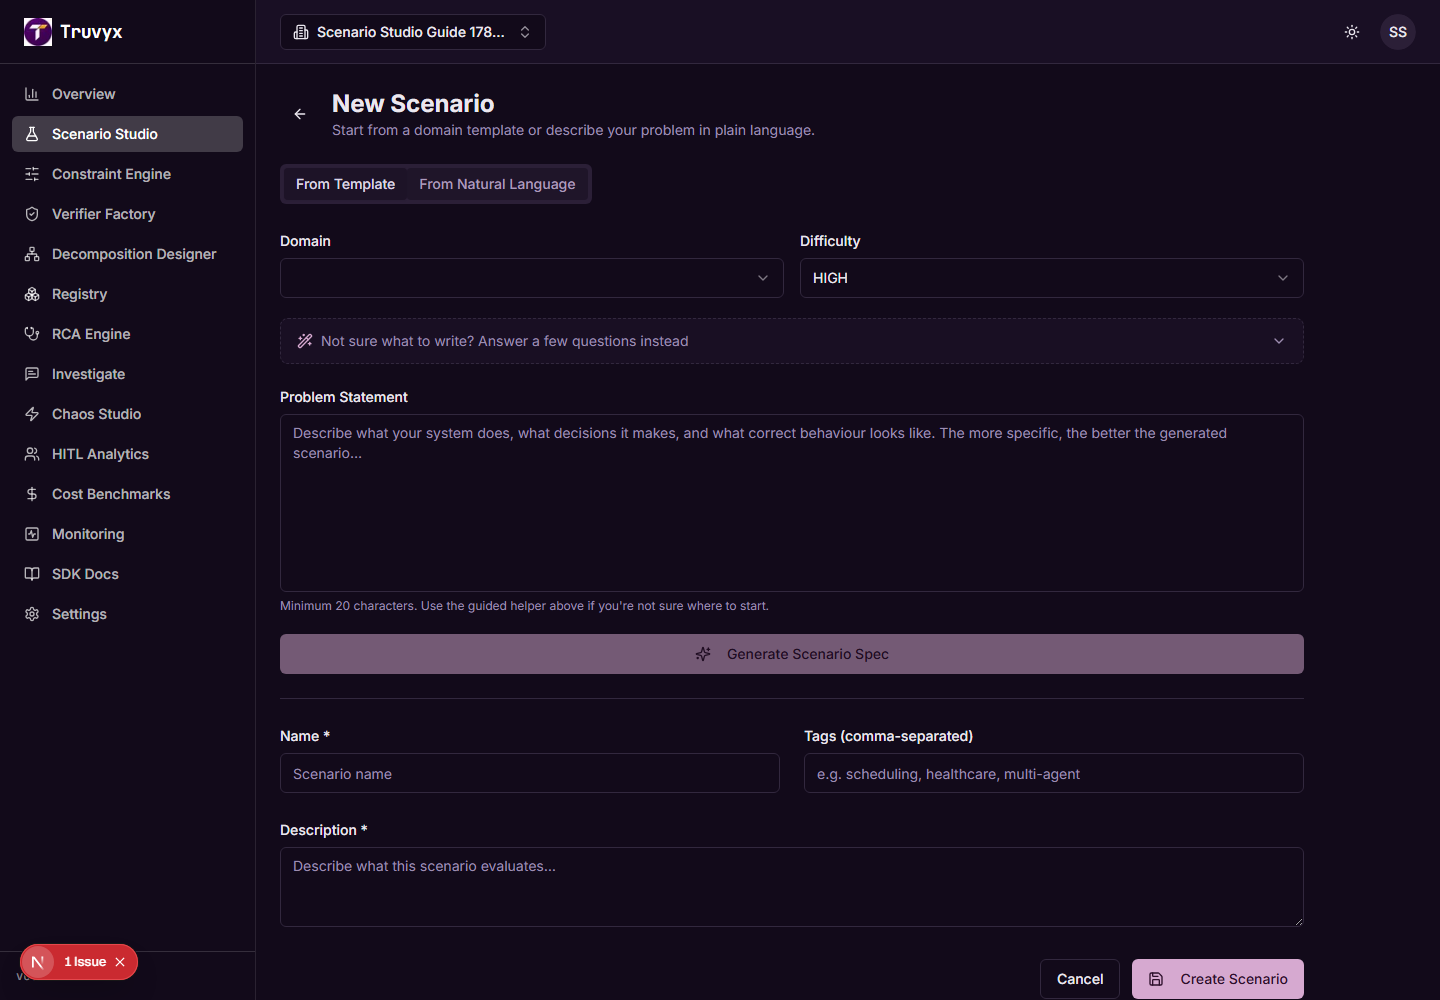
Choose From Template when one of the supplied domains is close to your workflow. Choose From Natural Language when you need to describe a specific operation in ordinary language. The natural-language provider creates a draft specification; it does not become policy until you read and save it. If the provider is unavailable, use the template path or write the fields manually rather than assuming the scenario was created.
Do this on the screen
- 1Start a new scenario
In Scenario Studio, select New Scenario. Set a domain and difficulty that fit the decision’s risk and complexity.
- 2Use the guided intake if needed
The helper asks what the product does, what decisions it makes, what could go wrong, and who is affected. Answer in plain language, then edit the generated problem statement.
- 3Review the draft specification
Check the name, description, roles, expected output, parameters, and constraints. Make vague words such as ‘safe’ or ‘good’ testable by adding a specific rule or escalation condition.
- 4Save version 1
A saved scenario becomes the reference point for later comparisons. When you change a material rule, create a new version so a past run remains interpretable.
What comes next: Scenarios define the test. Next, define and validate the rules that make the test meaningful.
Make correctness explicit in Constraint Engine
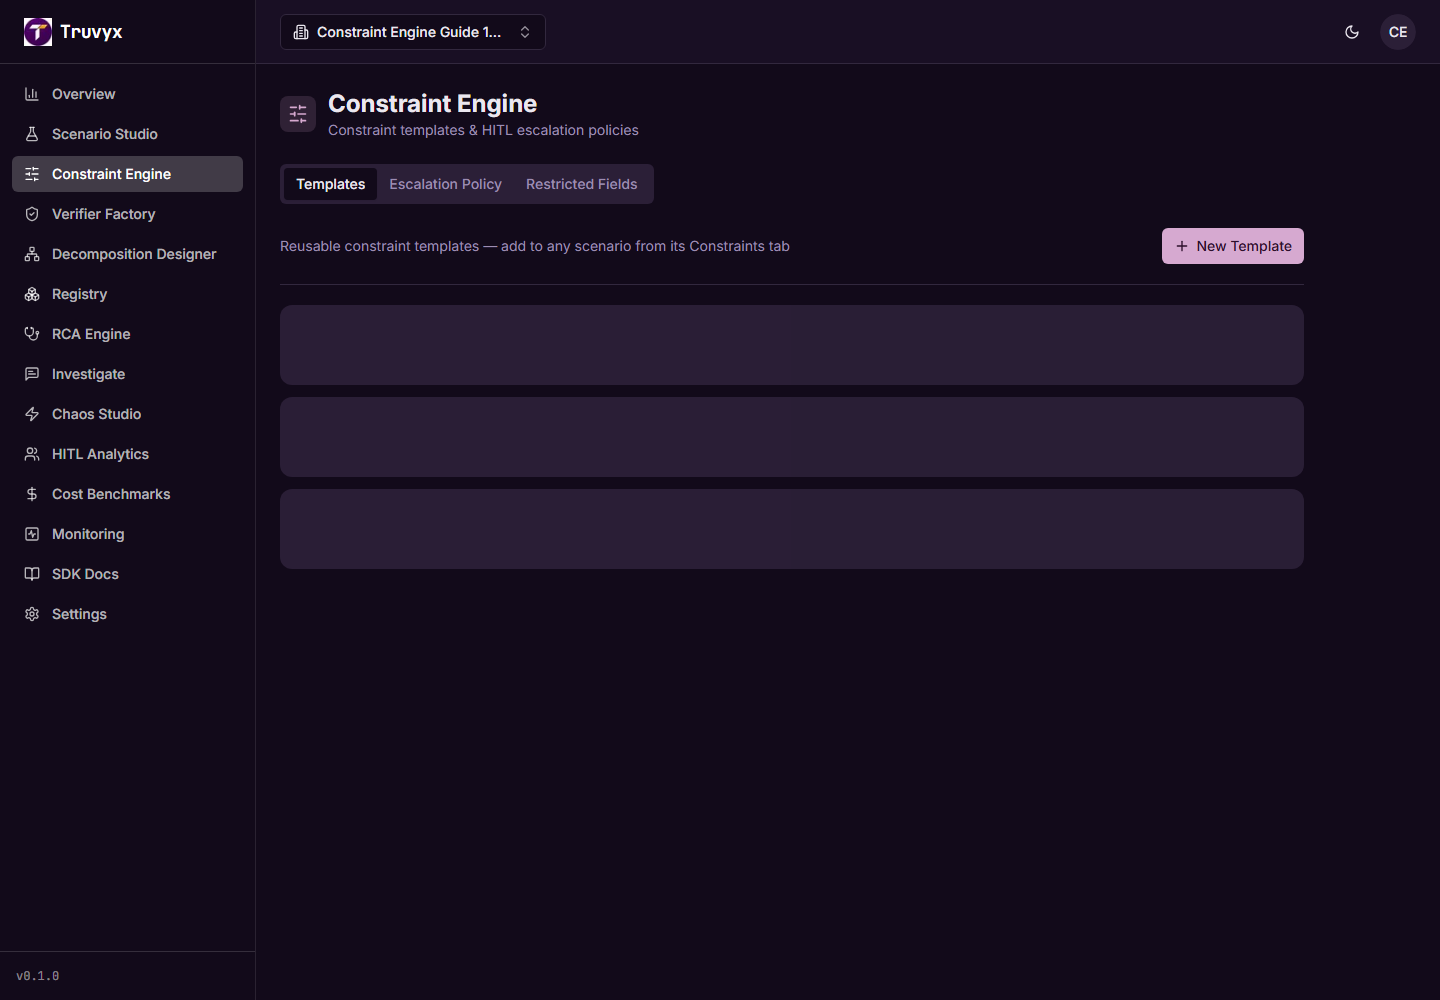
Constraint Engine is where plain-language requirements become rules with a type, category, evidence expectation, and consequence.
Use HARD for a rule that must not be violated. A hard rule should say what must be observed and what should happen when the evidence is absent. Use SOFT for an optimisation or preference that can influence the score without making the whole run unacceptable. Do not use a soft score to hide a regulatory or safety requirement.
Spread the first scenario across categories. A real multi-agent workflow often needs a safety or regulatory rule, a data-governance rule, a temporal or dependency rule, and an optimisation preference. The category is useful later: it lets you see whether a regression is concentrated in timing, access boundaries, handoffs, or cost.
Do this on the screen
- 1Start from a template where possible
Templates give beginners a correctly shaped starting point. Read the wording and make it specific to the product before saving.
- 2Create at least five rules
Add the rule name, HARD or SOFT type, category, and a precise description. Include expected actions, forbidden actions, or evidence sources when they are important.
- 3Check feasibility and contradictions
Run the available feasibility or conflict check before you trust a scenario. A formal check proves only the modelled rules are consistent; it does not prove the AI will follow them.
- 4Protect restricted fields
Use Restricted Fields for output that must be redacted, blocked, or audited across the organisation. A restriction should produce an evidence-backed state, not an unexplained pass.
What comes next: Once rules are stable, generate and inspect the verifier that will apply them to a run.
Generate a verifier and submit an evaluation
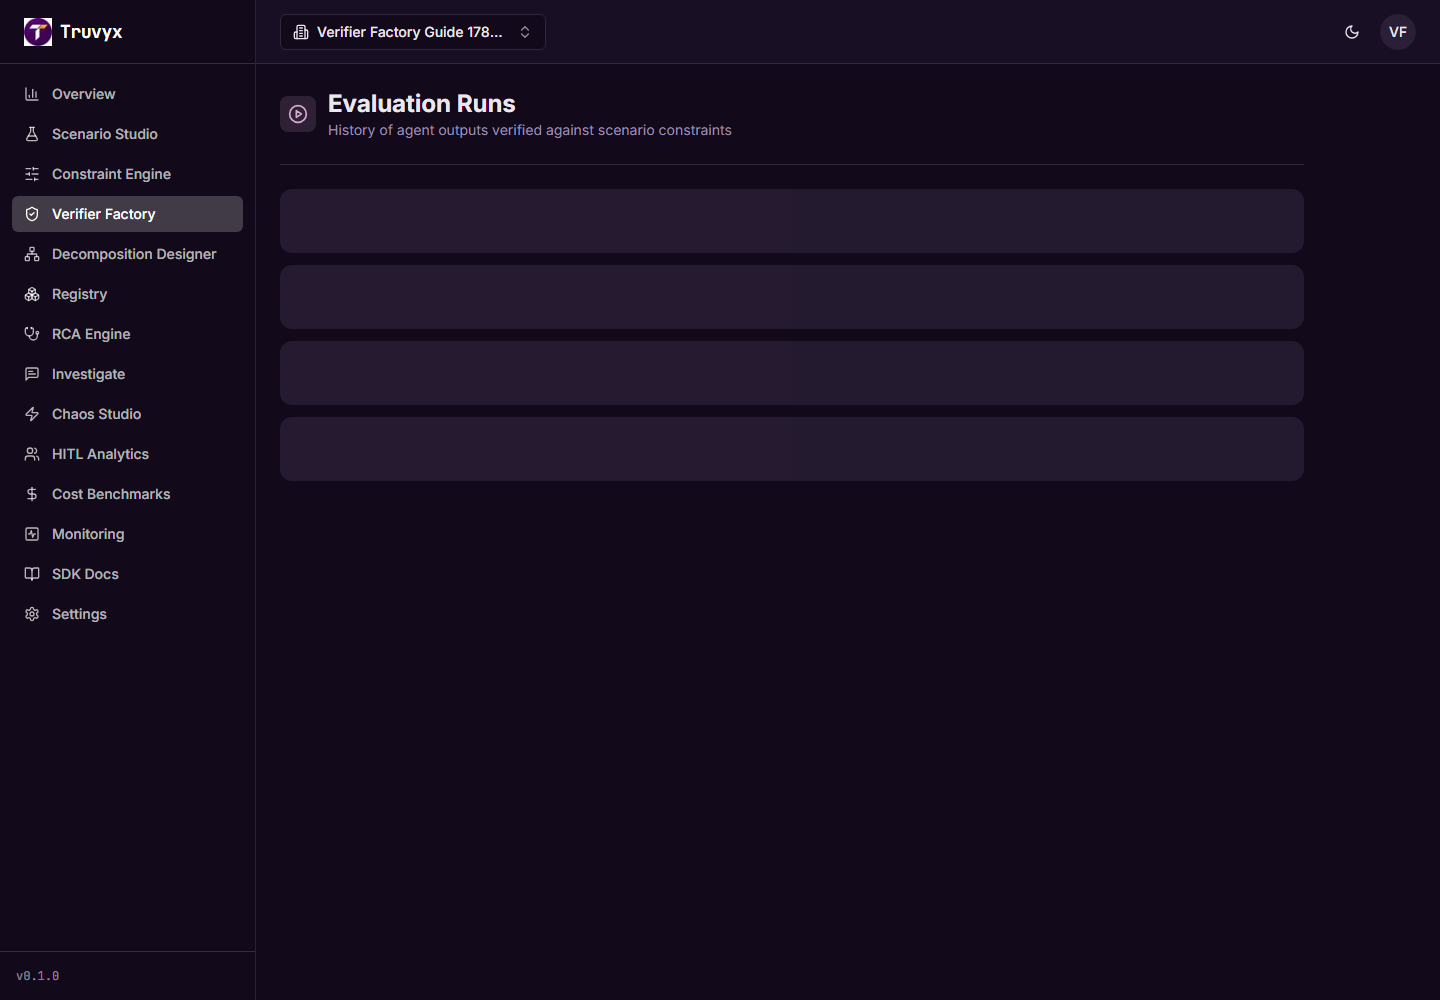
Verifier Factory connects the scenario’s rules to an executable evaluation record. Runs are the permanent evidence of one agent output being evaluated at one point in time.
From a scenario, generate or open its verifier. A good verifier makes checks repeatable: it records the scenario version, verifier version or checksum, the structured output it examined, and evidence for each result. A score without a per-constraint explanation is not enough for a consequential decision.
For the first run, manual submission is useful. Paste a real or representative structured output, select the scenario and product context, name the agent system, and submit. For normal engineering work, send the same payload from your SDK, REST integration, or CI workflow. Treat PENDING or RUNNING as non-terminal states; do not read them as a pass.
Do this on the screen
- 1Open the scenario verifier
Use the scenario detail page’s Verifier action. Confirm the rules and scenario version are the intended ones before execution.
- 2Submit a run
From Evaluation Runs, choose Submit evaluation. Supply the scenario, agent-system name, environment, structured agent output, and optional safe trace or cost metadata.
- 3Wait for a terminal state
Refresh or poll until the run is PASSED, FAILED, or PARTIAL. A worker delay or missing evaluator evidence must remain visible instead of being converted to a score.
- 4Read evidence before the headline score
Open the run. Review feasibility, completeness, optimality, each constraint’s state, violations, missing evidence, cost profile, trace references, and recommended next action.
What comes next: Use a passing and a failing sample at least once. The failing sample teaches your team how to read the product’s evidence and RCA flow.
How to read a result without fooling yourself
Start with the terminal status, then examine each hard constraint, its evidence, and anything marked not scored or missing. Feasibility tells you whether the modelled constraints can coexist. Completeness tells you whether the required evidence and checks are present. Optimality compares preferences such as cost or efficiency. None of these labels should hide an unavailable worker, a failed evaluator, or evidence that was never supplied.
Model the multi-agent workflow in Decomposition Designer
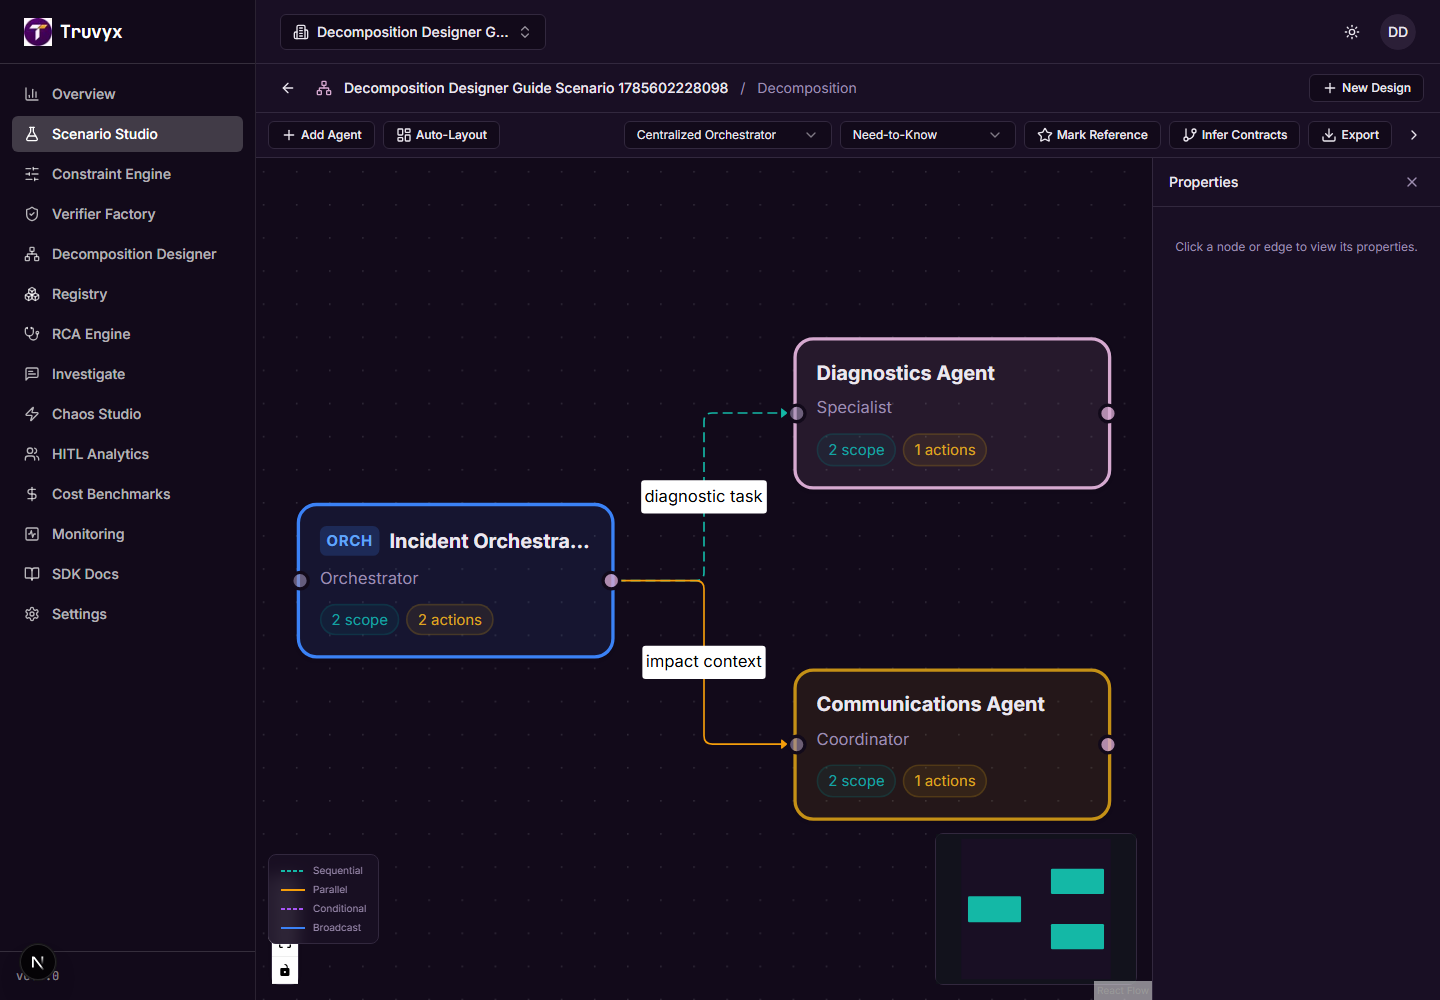
Decomposition Designer makes the hidden workflow visible: roles, tasks, dependencies, handoffs, shared memory, tools, fallbacks, and approval points.
Use this module when a final answer alone cannot explain quality. A multi-agent system can fail even when each individual model response appears reasonable: an agent can receive stale context, a dependency can be missing, two agents can own the same task, or a retry can loop without a bound.
Start from the scenario, then represent the workflow honestly. A node should have an owner and a purpose. An edge should describe the input or handoff, including any approval point. The diagram is not decoration; it is the design that Scenario Studio, Constraint Engine, Verifier Factory, and RCA use to make failures easier to locate.
Do this on the screen
- 1Add agent roles and tasks
Use one node per meaningful responsibility. Avoid naming several unrelated responsibilities as one agent because it prevents accountable diagnosis later.
- 2Connect dependencies and handoffs
Draw edges for the data or decision that moves between roles. Mark where a tool call, shared memory read, human review, retry, or fallback occurs.
- 3Run structural checks
Fix unowned tasks, circular dependencies, unconnected outputs, duplicate responsibilities, missing verification steps, unsafe handoffs, and unbounded retries before you trust the workflow.
- 4Link the design to the scenario
Save the design against the scenario version. A later RCA report can then distinguish a bad model answer from a bad decomposition or handoff.
What comes next: When the design is useful beyond one run, publish the approved version in Registry for safe reuse.
Reuse approved assets in Registry
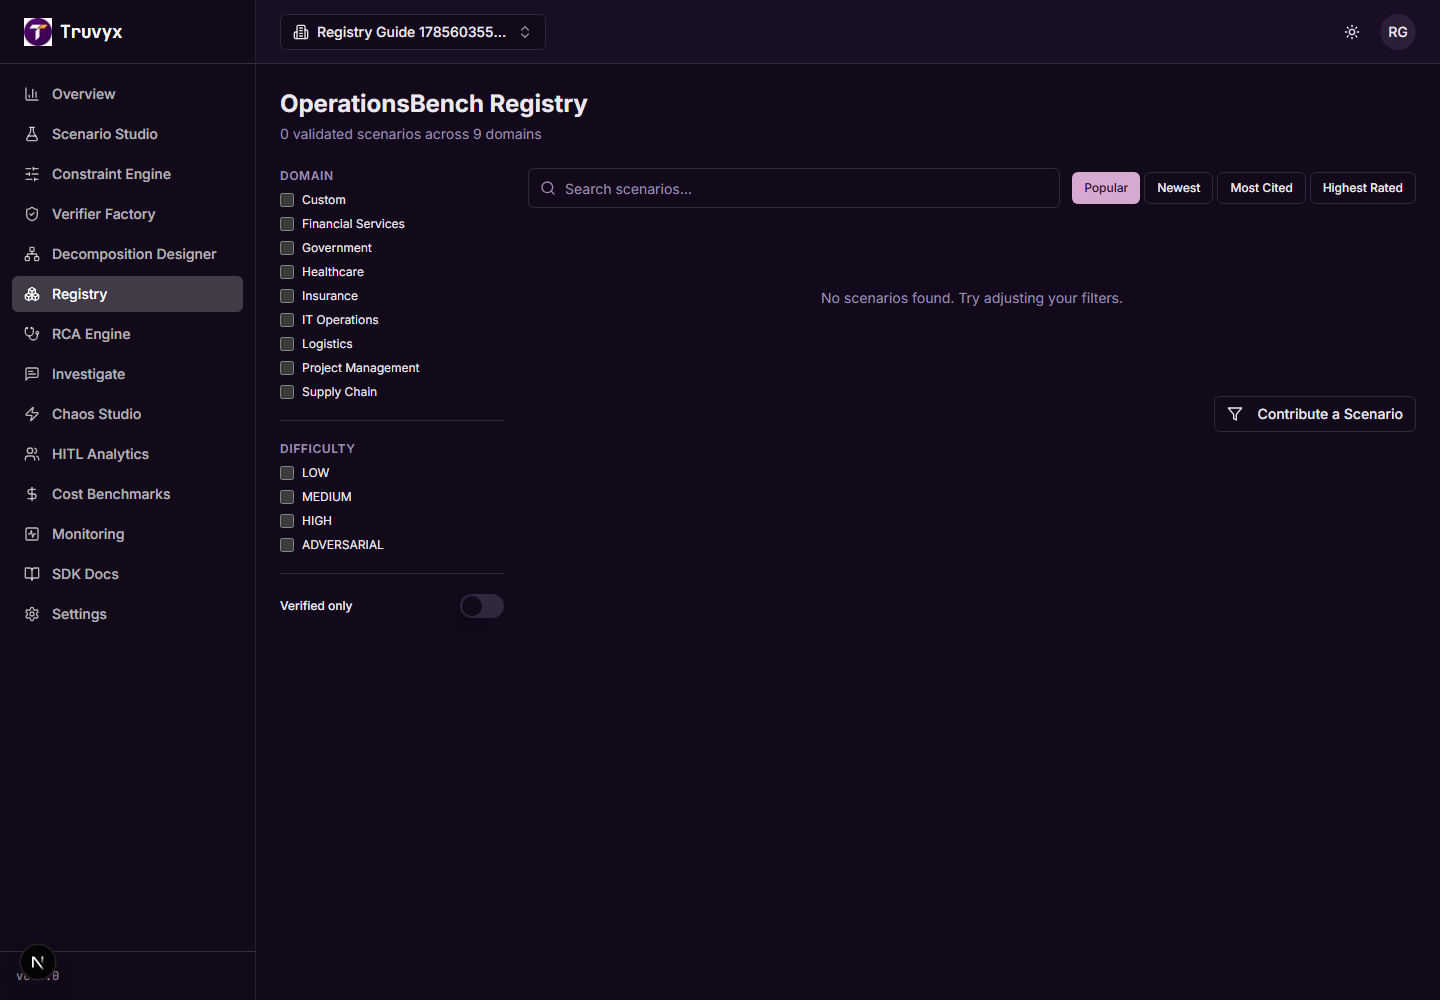
Registry is the versioned catalogue for scenarios, templates, constraints, verifiers, agent systems, models, tools, datasets, MCP servers, and evaluation suites.
Registry prevents a team from repeatedly rebuilding the same evaluation assets. It is the place to find something that has an owner, version, status, tags, dependencies, approval state, and evaluation history. It should not be used as a dumping ground for drafts that have never been reviewed.
Before publishing, make sure the item has a clear purpose, stable version, appropriate visibility, and an associated evaluation or quality check. Use the resulting registry record when another team needs a trusted starting point, not merely a copy of some text from a previous project.
Do this on the screen
- 1Browse before creating
Search by asset type, domain, tags, and status. Inspect the owner, dependencies, last evaluation, and approval details before reusing an entry.
- 2Contribute a tested version
Choose the verified scenario, verifier, or result to contribute. Add a precise description and tags so another team can decide whether it fits their environment.
- 3Preserve version history
Publish a new version when behaviour changes. Do not silently overwrite a record that past runs or monitoring rules still reference.
What comes next: Registry is the reuse loop. The next modules explain failures and operate the system after runs begin arriving.
Diagnose a failure with RCA Engine
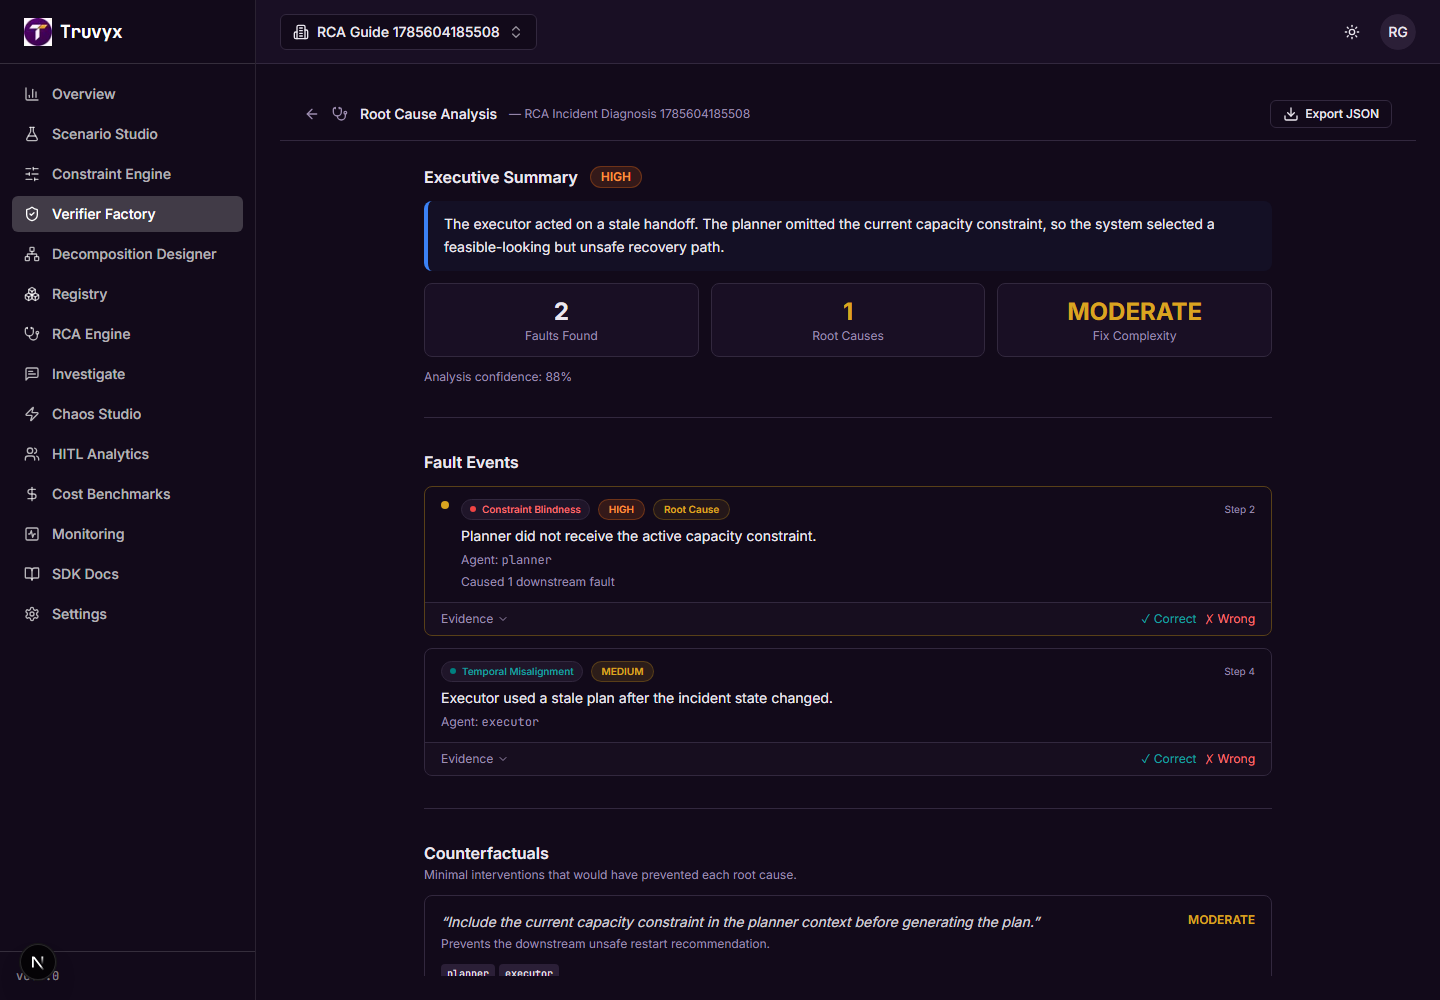
RCA Engine turns a failed run into an evidence-backed investigation with candidate causes, counterfactuals, and a smallest safe repair.
Open RCA from a failed run. Truvyx reads the evaluation evidence, trace references, workflow context, tool and memory events where available, and related patterns. It separates observed symptoms from a causal hypothesis. That distinction is essential: an AI-generated explanation is not proof simply because it sounds plausible.
A useful RCA report gives you a causal chain, provenance or confidence, linked evidence, counterfactual interventions, an owner, and a way to verify the repair. If the evidence is incomplete, the report must say so. The correct next action may be to collect a trace or rerun a controlled case rather than change production behaviour.
Do this on the screen
- 1Open the failed run first
Read which constraints failed, which were not scored, and what evidence was missing. This gives the RCA process a bounded question.
- 2Start the analysis
Use Analyze RCA. Confirm the run and its scenario version, then wait for the report to complete.
- 3Read the provenance labels
Treat observed trace facts differently from derived correlations and hypotheses. Follow links back to the run rather than accepting a conclusion without evidence.
- 4Choose the smallest repair and rerun
Use a counterfactual suggestion as a testable intervention. Preserve the original run, make one controlled change, rerun the same scenario, and compare the evidence.
What comes next: RCA explains one incident. Investigate helps you ask whether it is part of a wider pattern.
Ask cross-run questions in Investigate
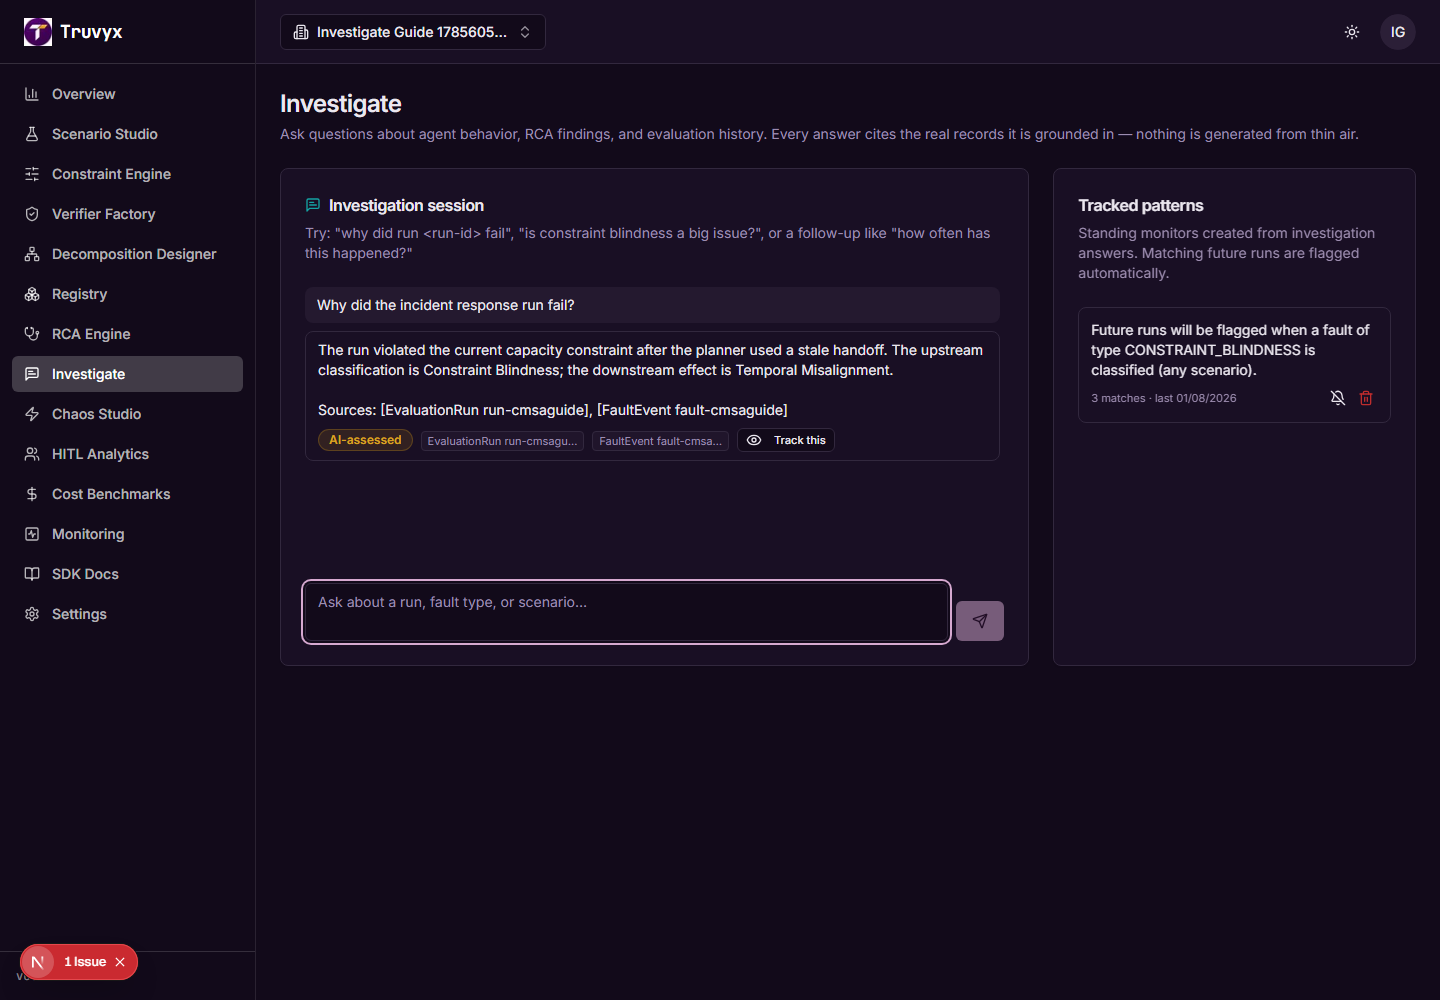
Investigate is the natural-language interface for grounded questions across runs, traces, RCA reports, patterns, agents, models, and environments.
Ask a focused operational question, such as ‘Why did this run fail?’, ‘Has this safety violation happened before?’, or ‘Did failures change after the staging deployment?’. Investigate should return a direct answer together with linked source records, the filters or time range used, evidence excerpts where safe, and a provenance or confidence statement.
It is acceptable for the answer to be ‘there is not enough data.’ A trustworthy investigation does not invent a pattern from one run, expose raw customer content, or turn a missing trace into a causal conclusion. Use the linked records to verify a surprising answer before changing a system.
Do this on the screen
- 1Set the scope
Choose the organisation, product, environment, scenario, model, agent, or time range when those filters are available. Narrowing the question makes the evidence easier to inspect.
- 2Ask one operational question
Include the run ID or deployment context where you have it. Start with a known failure rather than an abstract request for ‘insights’.
- 3Follow source links
Open the cited runs, RCA reports, constraints, and traces. If no source supports the answer, treat it as a hypothesis and collect more evidence.
- 4Track a verified pattern
Once a person validates a repeated issue, track it and create a regression or monitoring response instead of repeatedly asking the same question.
What comes next: Use the investigation to inform a regression test, monitoring rule, or controlled resilience experiment.
Test resilience safely in Chaos Studio
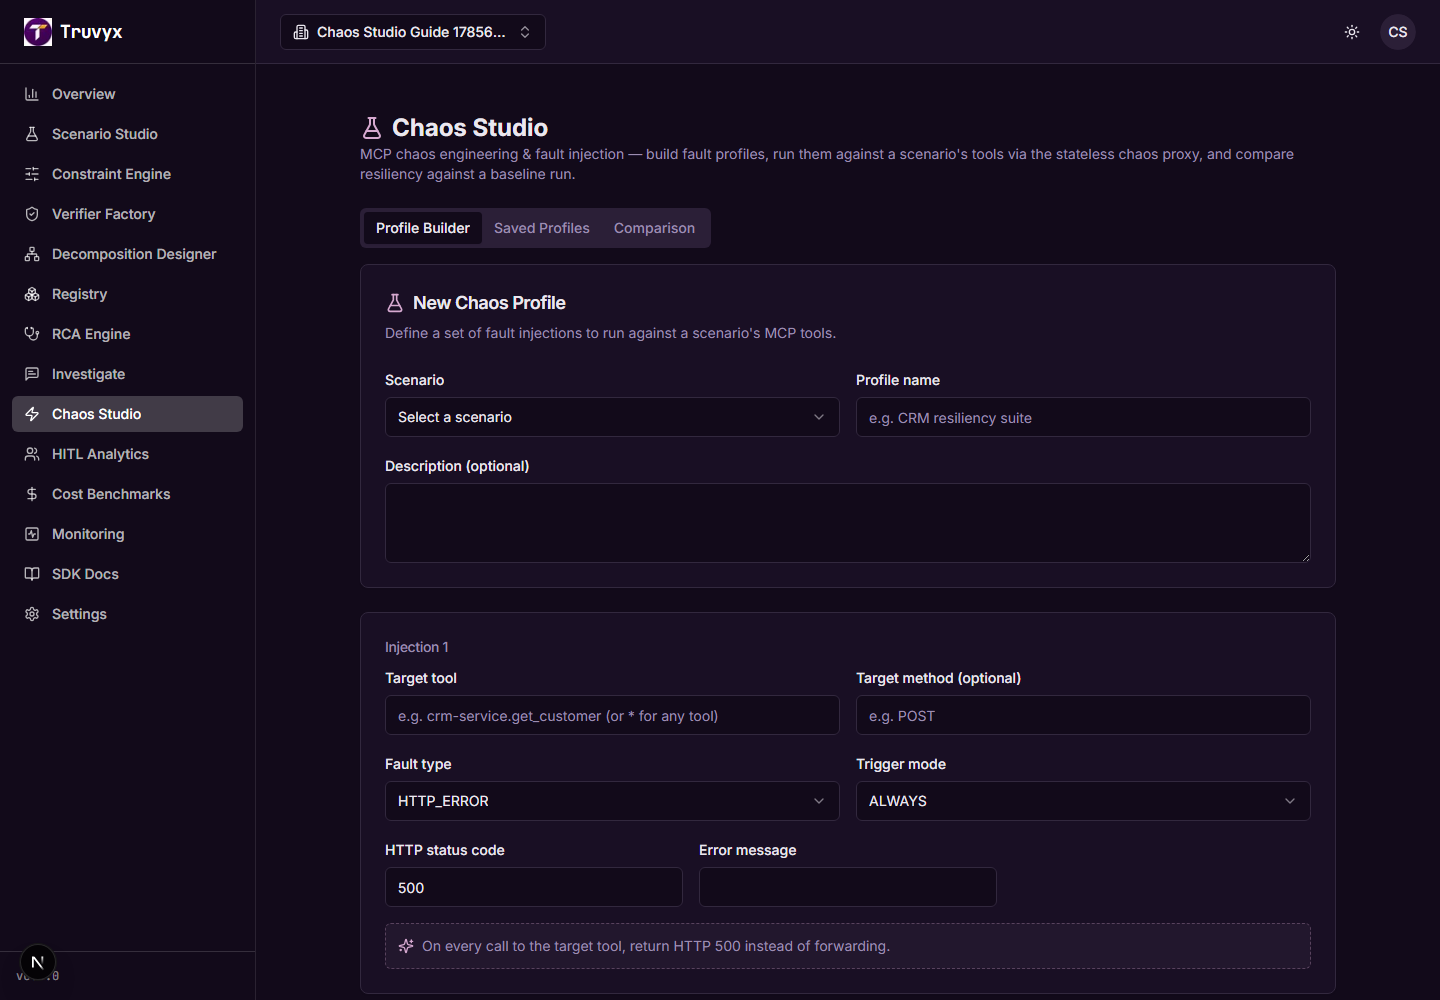
Chaos Studio runs controlled fault experiments so a team can learn how an agent system responds before an equivalent fault occurs unexpectedly.
Chaos experiments should be isolated from production by default. Begin with a staging product, a known scenario, an explicit abort condition, and a narrow fault. The point is not to make the system fail dramatically. The point is to see whether it fails safely, records the right evidence, respects boundaries, and recovers as designed.
Useful first faults include a bounded latency injection, a timeout, a missing tool response, an authentication error, payload corruption, stale memory, a delayed handoff, or provider unavailability. Decide what acceptable behaviour looks like before you run the experiment: retry once, use a fallback, escalate to a human, block the result, or stop the workflow.
Do this on the screen
- 1Choose a staging target
Never point a first experiment at production by accident. Confirm the product and environment in the profile before enabling a profile.
- 2Create a fault profile
Set the fault type, target, intensity, duration, expected behaviour, and abort condition. Write down what should be observed if recovery is working.
- 3Run and observe
Start the experiment, then review the resulting run, traces, recovery behaviour, and any constraint failures. An unavailable worker or missing evidence is itself a result, not a pass.
- 4Link the learning
Attach the relevant scenario and RCA record. Turn a confirmed weakness into a regression suite or monitoring threshold.
What comes next: Resilience tests produce operational evidence. Use HITL Analytics when humans take part in the recovery or decision process.
Measure human review in HITL Analytics
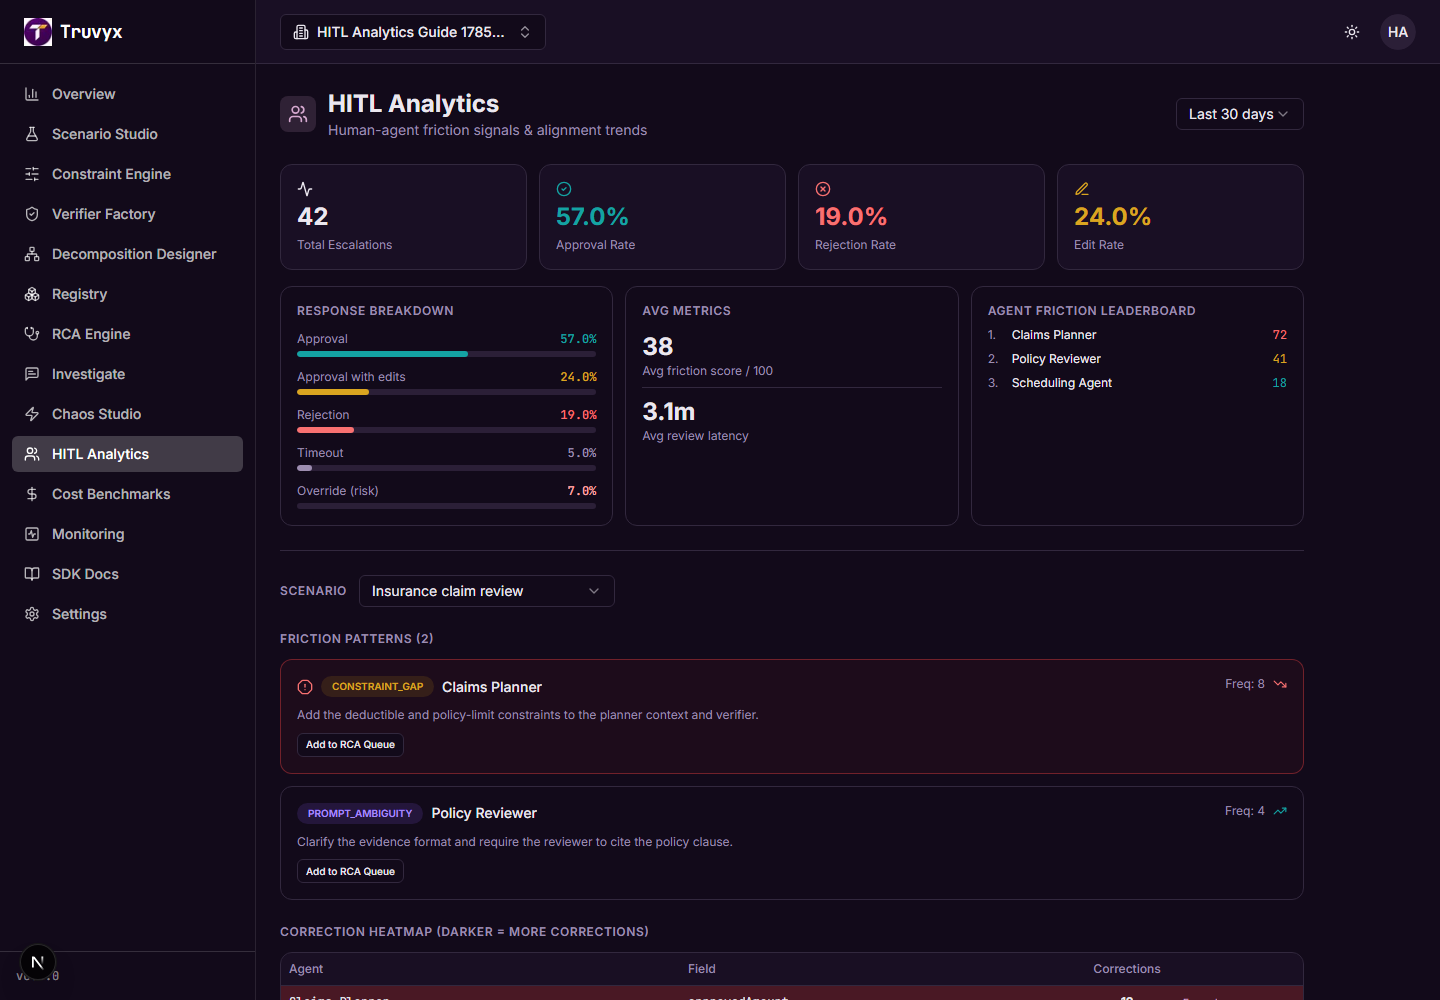
HITL Analytics shows whether human review is reducing risk or merely compensating for an unclear or unreliable automated workflow.
Human-in-the-loop is not a checkbox. Record why the agent escalated, how long the review took, whether the reviewer accepted, rejected, or edited the result, and whether the reviewer agreed with the agent and verifier. This turns an invisible manual safety net into a measurable part of the system.
Use outcomes by scenario, model, agent, product, and environment. A high override rate can mean the model is weak, the constraints are incomplete, the escalation threshold is too low, or reviewers are correcting a workflow defect. Follow the record into the original run and RCA report before drawing conclusions.
Do this on the screen
- 1Mark escalation points in the design
In Decomposition Designer and the scenario, show where a human must approve, revise, or take over. This supplies context for later outcomes.
- 2Record the reviewer outcome
From the run or escalation decision, record accepted, rejected, overridden, edited, or unresolved. Include only the necessary evidence and preserve access controls.
- 3Review agreement and time
Look at volume, review time, acceptance, rejection, edit rate, false-positive escalations, and missed escalations. Compare like-for-like scenarios.
What comes next: Cost Benchmarks adds the efficiency lens: whether quality is being bought at an acceptable cost.
Compare quality and spend in Cost Benchmarks
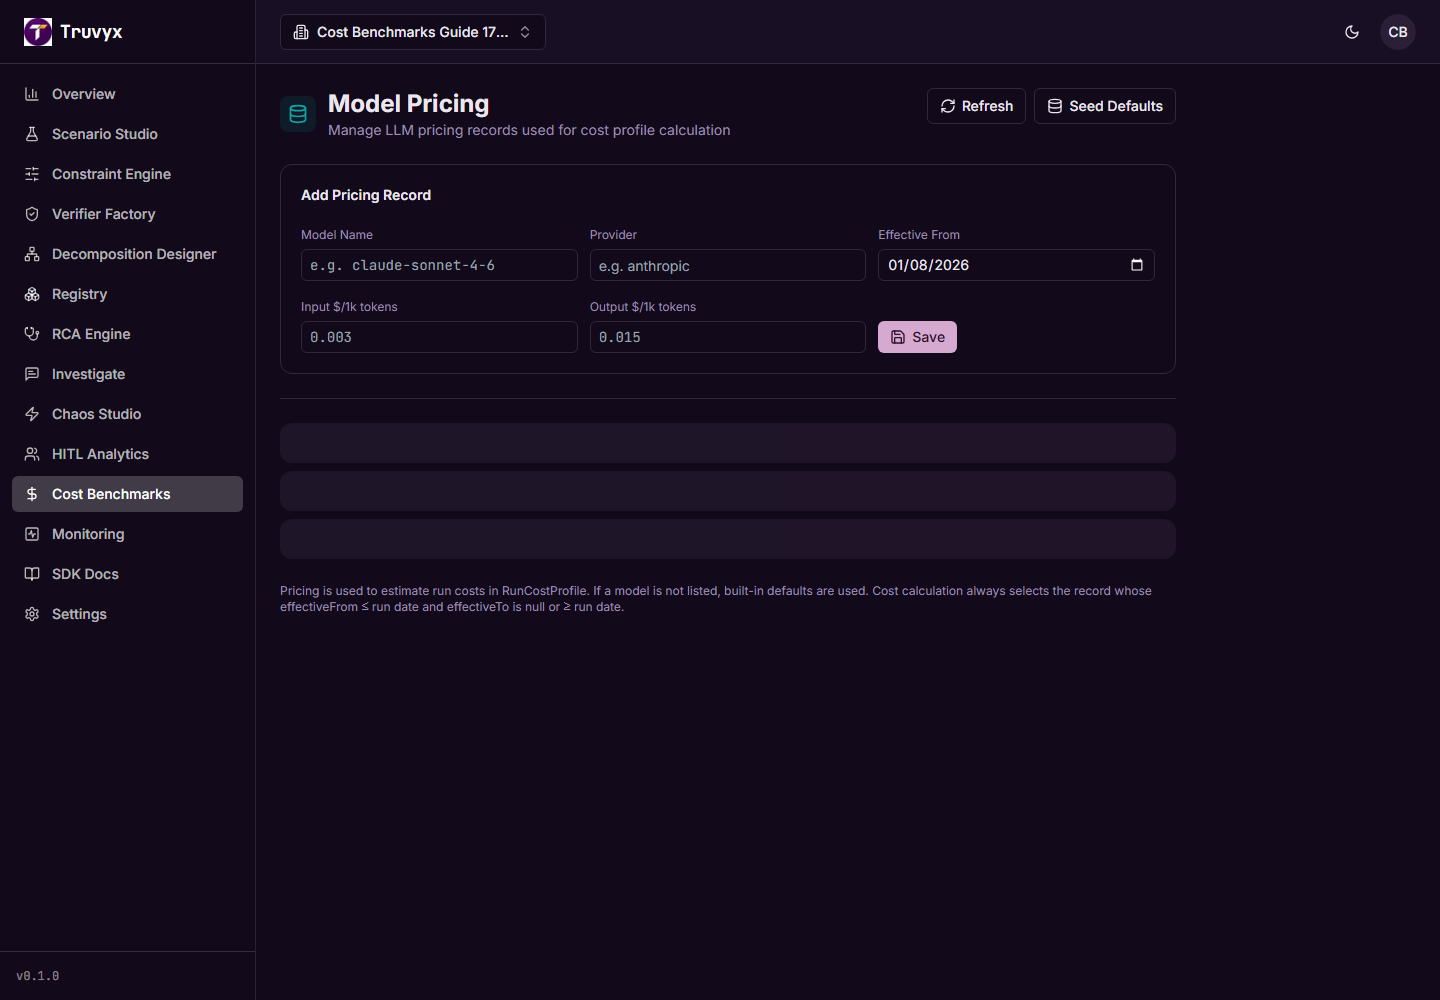
Cost Benchmarks relates model, agent, tool, and token cost to equivalent evaluation outcomes instead of rewarding the cheapest incomplete run.
A low-cost run is not automatically efficient. If it skipped a verifier, omitted an evidence source, or bypassed human review, it is not comparable with a fully evaluated run. Use the same scenario, version, constraints, and output requirements when comparing a model, routing strategy, or agent decomposition.
The useful measures are cost per correct decision, tokens per satisfied critical constraint, cost and latency by agent, redundant calls, p50 and p90 cost, and projected spend at volume. Capture safe token and latency metadata through your integration so the benchmark has enough information without receiving raw prompts or secrets.
Do this on the screen
- 1Start with equivalent runs
Select runs that use the same scenario and evaluation contract. Split production and staging when their inputs or model settings differ materially.
- 2Inspect the cost profile
Review input and output tokens, calls, latency, per-agent contribution, and redundant work. Confirm whether any required verification was skipped.
- 3Compare options
Use a model or configuration comparison to assess the quality-cost trade-off. Keep a baseline so a lower bill does not mask a new failure mode.
- 4Feed a decision back into monitoring
If a cost change is approved, set a corresponding quality guardrail. A cheap change that regresses a hard constraint should not auto-promote.
What comes next: Monitoring turns the coverage you have built into ongoing protection for new deployments and production samples.
Protect future changes with Monitoring
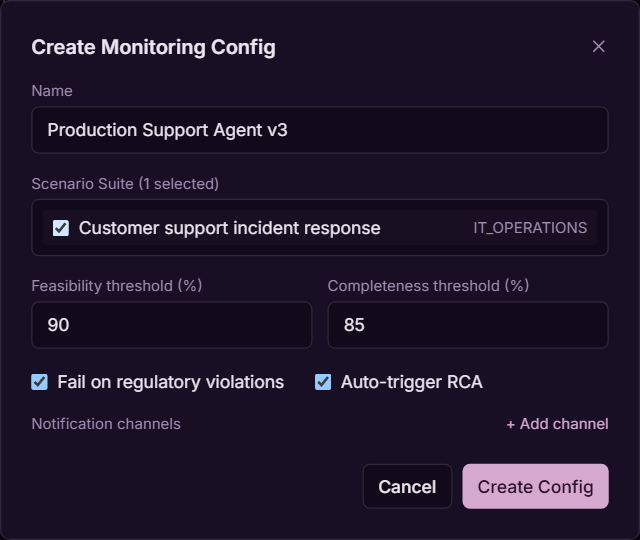
Monitoring applies a scenario and its thresholds repeatedly: on deployment, against a production sample, or only when manually triggered.
Enable monitoring only after you understand at least one passing and one failing evaluation. Choose a baseline run or approved scenario version, decide which score or constraint should trigger action, and make the notification route explicit. A monitoring configuration is an operational promise, so it needs an owner and an environment.
An alert should say what changed, when it changed, which product and scenario detected it, which constraint failed, whether evidence is complete, whether RCA is available, and what to do next. Monitoring is not a substitute for a run detail page; it is the service that tells you when to open one.
Do this on the screen
- 1Create a configuration
Choose product, environment, scenario or suite, mode, threshold, baseline, and desired response. Label manual runs clearly so they do not look like production samples.
- 2Choose notifications
Connect Slack, email, or PagerDuty in Settings first, then select only channels that have an accountable recipient. Test one non-critical alert before relying on it.
- 3Enable automatic RCA selectively
Use RCA for selected failures when enough trace and evaluation evidence exists. Keep the report’s provenance labels visible to responders.
- 4Review and resolve alerts
Open the source run, decide whether the alert is a real regression, and record the remediation state. Use Quality Issues for work that needs ownership over time.
What comes next: Turn repeatable or material failures into Quality Issues so ownership and remediation are not lost in an alert feed.
Track remediation in Quality Issues
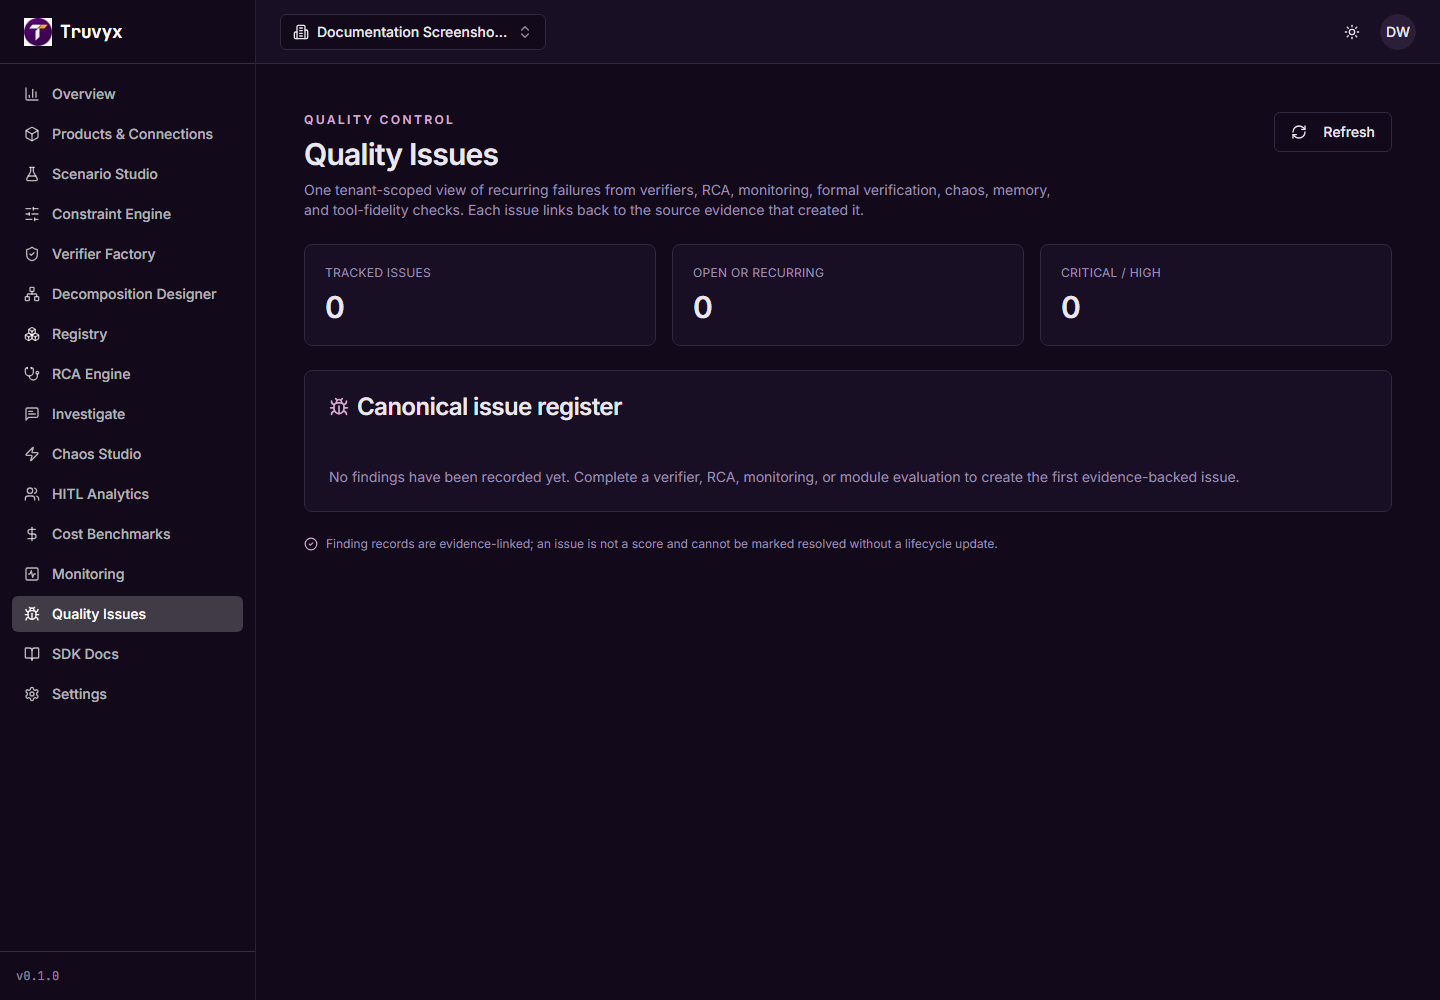
Quality Issues is the operational queue for risks that require ownership, a remediation state, linked evidence, and regression protection.
Create an issue when a failure is material, recurring, or needs work across teams. Link it to the representative run, relevant constraints, RCA report, product, environment, and monitoring configuration. This preserves the path from a dashboard symptom to the repair that actually closed it.
Do not resolve an issue because a single rerun happened to pass. A sound closure records the change, owner, verification run, remaining uncertainty, and whether a regression suite or monitoring rule now protects against recurrence.
Do this on the screen
- 1Create from a real source record
Start from a failed run, alert, or RCA report where possible. This automatically gives the issue an evidence trail instead of a vague title.
- 2Assign ownership and severity
Record the responsible person or team, SLA, age, escalation status, and remediation state. Keep production impact separate from a local experiment.
- 3Attach the fix and proof
Link the code, prompt, policy, or workflow change, then attach the rerun or verification record that demonstrates the intended effect.
- 4Protect against recurrence
Create or update a regression suite and monitoring rule. If no protection exists, leave the issue open or explicitly record the accepted risk.
What comes next: Use SDK Docs, REST, CI, or MCP to make this operating loop repeatable from the systems your team already uses.
Integrate through REST, SDKs, and CI
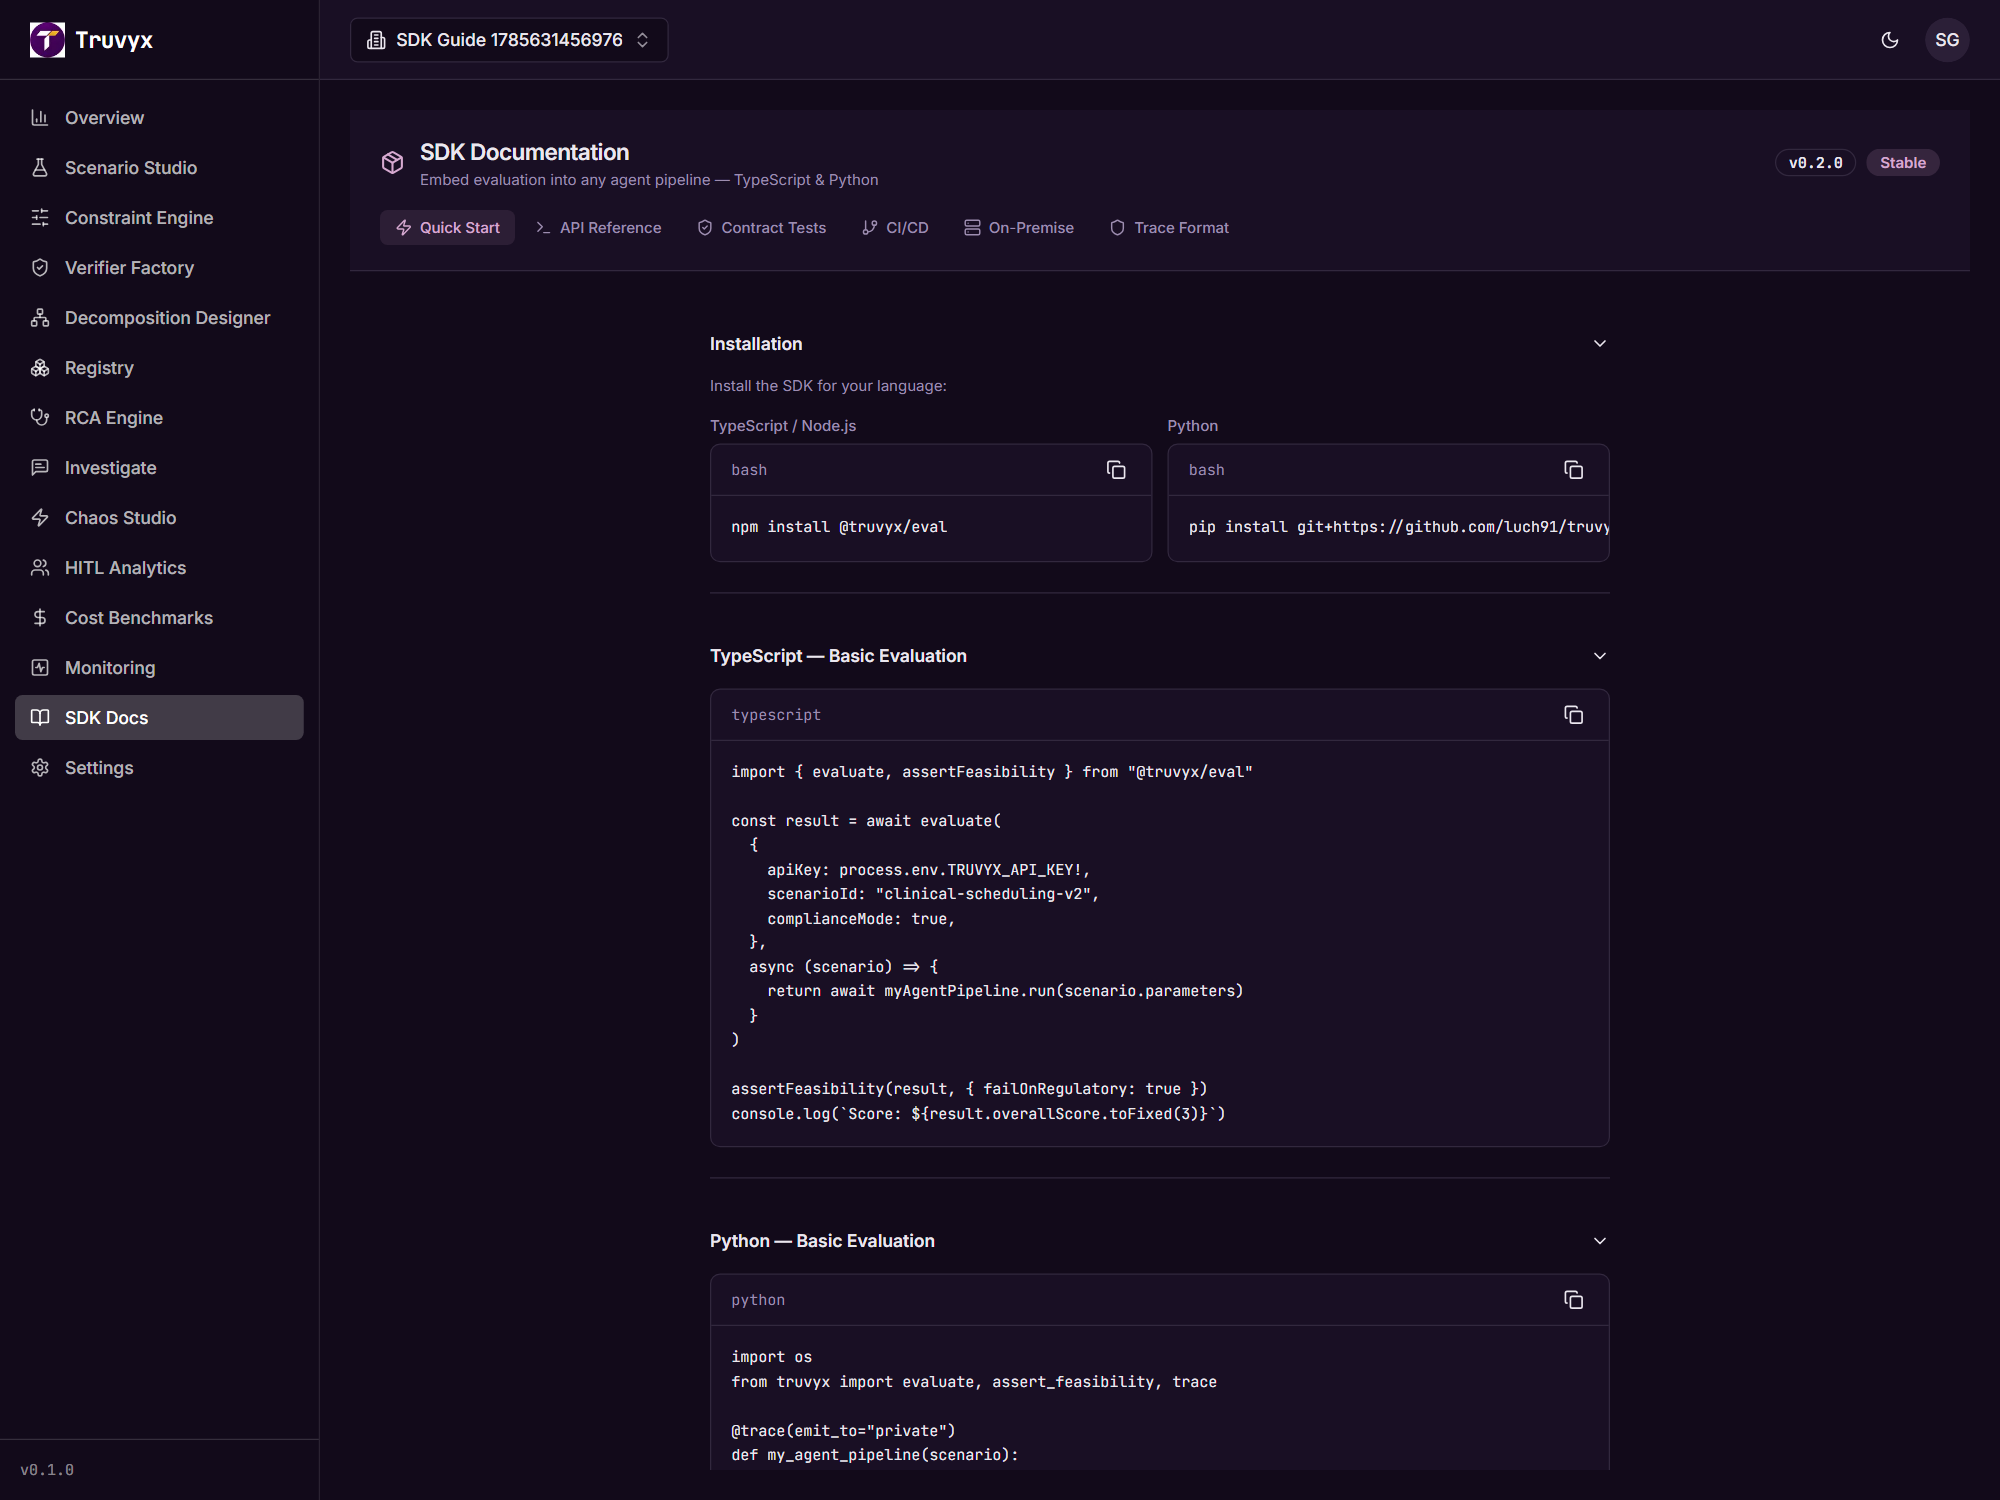
SDK Docs is the executable integration reference. It makes one versioned API contract canonical rather than asking developers to guess between old and new endpoints.
Use the versioned REST endpoint as the common denominator: submit with POST /api/v1/evaluate, then retrieve a result with GET /api/v1/runs/[runId]/result. The request uses camelCase fields such as scenarioId, agentSystemName, and agentOutput. The response gives a run ID; your pipeline should poll until a terminal result and then decide whether the threshold or critical-violation policy blocks the build.
Use TypeScript or Python only where the published client package and documentation match the current API. Until a Python package is officially published to PyPI, follow the repository or REST instructions shown in SDK Docs rather than advertising an unavailable pip package. GitHub Actions, GitLab CI, and generic CLI integrations should store trk_ keys as secrets and upload a result report as an artifact.
Do this on the screen
- 1Create a least-privilege key
In Settings → API Keys, create a named key for one integration. Grant runs:write to submit, runs:read to poll, and only the additional scopes that its job requires.
- 2Submit a structured output
Run your agent in your own environment, then submit the result with its scenario, agent-system name, product/environment metadata, and allowed trace or cost fields.
- 3Poll and gate
Wait for the terminal result, read constraint results and severity counts, and fail the CI job only according to a documented threshold or critical-violation policy.
- 4Keep the run ID
Put the run URL or ID into deployment logs and CI artifacts. It is the link your operators need when an alert or issue appears later.
What comes next: For developer-assistant workflows, use MCP as a scoped control-plane connection rather than another telemetry channel.
Connect a coding agent through MCP
The Truvyx MCP server gives MCP-capable developer tools a scoped control-plane interface for scenarios, verifiers, runs, traces, and investigations.
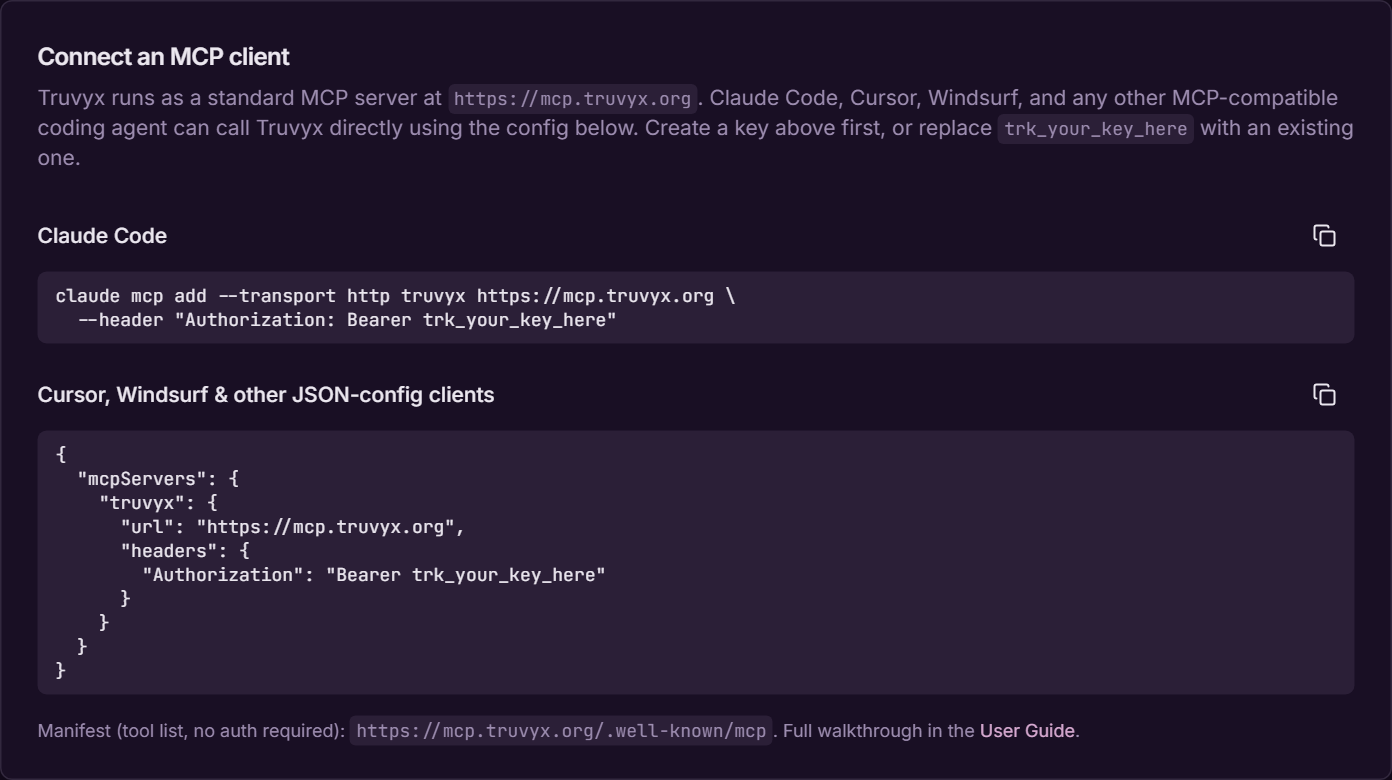
MCP is best when a developer works from Claude Code, Cursor, Windsurf, Cline, Zed, Goose, or another compatible client. Create an API key with the smallest required scopes, add https://mcp.truvyx.org to the client, and supply the key in Authorization: Bearer or X-Truvyx-Key. The public manifest describes available tools; authenticated calls are limited to the key’s organisation.
MCP should not silently ingest customer data. A visible tool call should create or find a scenario, trigger a verifier, inspect a run, search traces, or start an investigation. The resulting run remains linked to the dashboard so the same evidence is available to people who are not in the developer’s editor.
Do this on the screen
- 1Create a scoped key
Name the key after the device or client, copy it once, and store it in the MCP client’s secure configuration. Revoke it when the device or staff access changes.
- 2Add the server
Use https://mcp.truvyx.org and the Bearer or X-Truvyx-Key header. The manifest at /.well-known/mcp can be inspected before an authenticated connection.
- 3Verify tools
Ask the client to list tools. Then try a low-risk read operation before allowing a tool to create a scenario or trigger a verifier.
- 4Follow the dashboard link
When a tool returns a run or investigation, open it in Truvyx to inspect the evidence, ownership, and audit trail.
What comes next: Finish the setup in Settings so keys, people, alerts, compliance controls, exports, and billing have clear ownership.
Set the operating rules in Settings
Settings is the organisation lifecycle area: identity, members, API keys, integrations, compliance, data controls, exports, billing, and environments.
Complete Settings before a production rollout, not after an alert arrives. Set the organisation details, invite only the teammates who need access, choose roles deliberately, and create named keys with narrow scopes. An owner should know where keys are used and should be able to revoke them without asking an engineer to search through code.
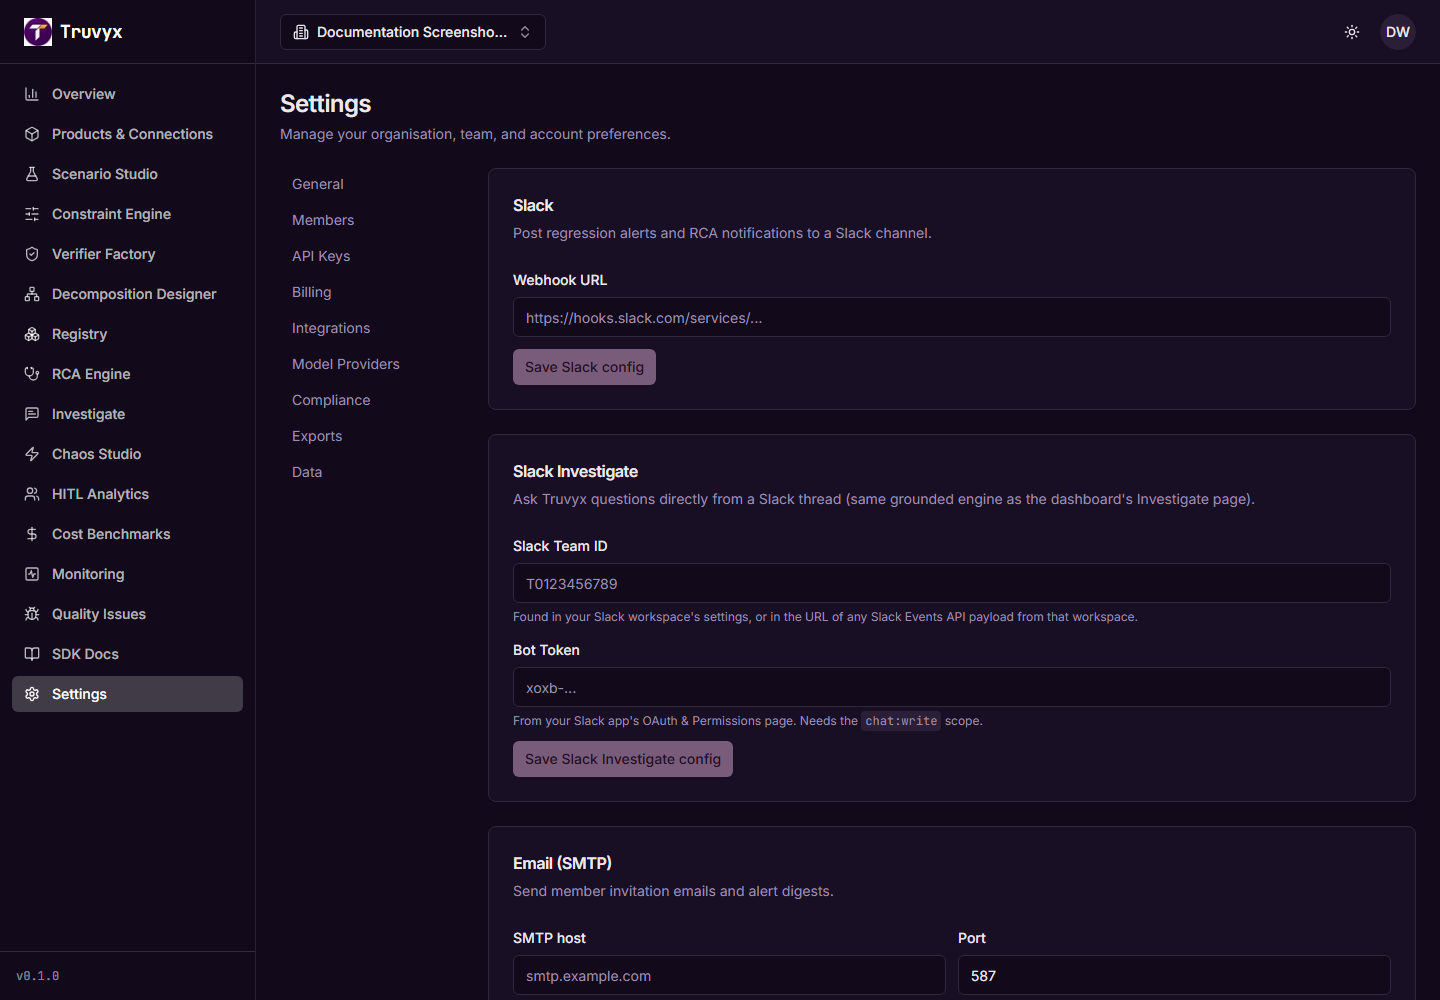
Connect Slack, email, or PagerDuty only after deciding who owns which alert. Configure model providers for Truvyx’s own assisted features separately from customer-product connections. Review compliance and restricted fields, data retention, exports, and audit records with the people responsible for risk and privacy. Never put raw prompts, outputs, or secrets into general-purpose analytics simply to make a dashboard more complete.
Do this on the screen
- 1Set organisation and member access
Confirm the owner, add admins and members only as required, and revisit access when a person changes teams or leaves.
- 2Manage API keys
Create one key per integration, use scopes, record its owner and purpose, rotate on a schedule, and revoke immediately after a suspected exposure.
- 3Connect notifications
Add Slack, SMTP/email, or PagerDuty credentials in Integrations. Send a test notification and document the on-call or escalation owner.
- 4Review governance and data controls
Set restricted fields, compliance rules, retention, exports, and audit requirements. A setting is only operational when someone is accountable for reviewing its effect.
What comes next: You are ready to run the complete loop: product → connection → scenario → constraints → verifier → run → evidence → RCA → remediation → monitoring.
Before you rely on Truvyx in production
Use this go-live check after the first end-to-end run.
- ✓ Every production product and environment is named correctly.
- ✓ Each connection has a least-privilege key and a verified test request.
- ✓ At least one scenario has versioned roles and five meaningful constraints across categories.
- ✓ A passing and a failing run have both been reviewed by a human.
- ✓ Not-scored and missing-evidence states have a documented response.
- ✓ Monitoring has an owner, a tested notification path, and a threshold that matches risk.
- ✓ A critical failure can be traced from alert to run, RCA, remediation, and regression proof.
- ✓ Restricted fields, exports, membership roles, retention, and audit requirements have been reviewed.