
Cost Benchmarks · Beginner tutorial
How to measure AI cost and efficiency in Truvyx
A successful AI run is not automatically an efficient run. Cost Benchmarks shows how many tokens and calls a workflow used, what those calls cost, where spend concentrates, whether calls were redundant, and how the run compares with other runs of the same scenario.
Cost is only meaningful beside quality
A cheaper run that violates a hard constraint is not a better run. Truvyx keeps cost metrics beside correctness and constraint results so you can compare cost per correct decision, tokens per satisfied constraint, and efficiency—not just the smallest dollar amount.
Before you begin: include an execution trace
Cost calculation reads LLM call traces from the run’s agentOutput. Truvyx supports an agent array with agent name, model name, and calls, or a calls array for a single anonymous agent. Each call can provide input/output token counts; when counts are missing, the calculator estimates tokens from content length.
Include latency, tool name, user content, response content, and model name where available. Without trace calls, a run can still exist, but there is not enough evidence to calculate a meaningful cost profile.
Submit the run through Verifier Factory or the API, then open its detail page and select Cost & Efficiency.
Step 1: understand the Model Pricing page
The dashboard label is Cost Benchmarks, and the pricing administration page is available at /admin/model-pricing. It is restricted to organisation admins and owners because changing rates changes financial reporting.
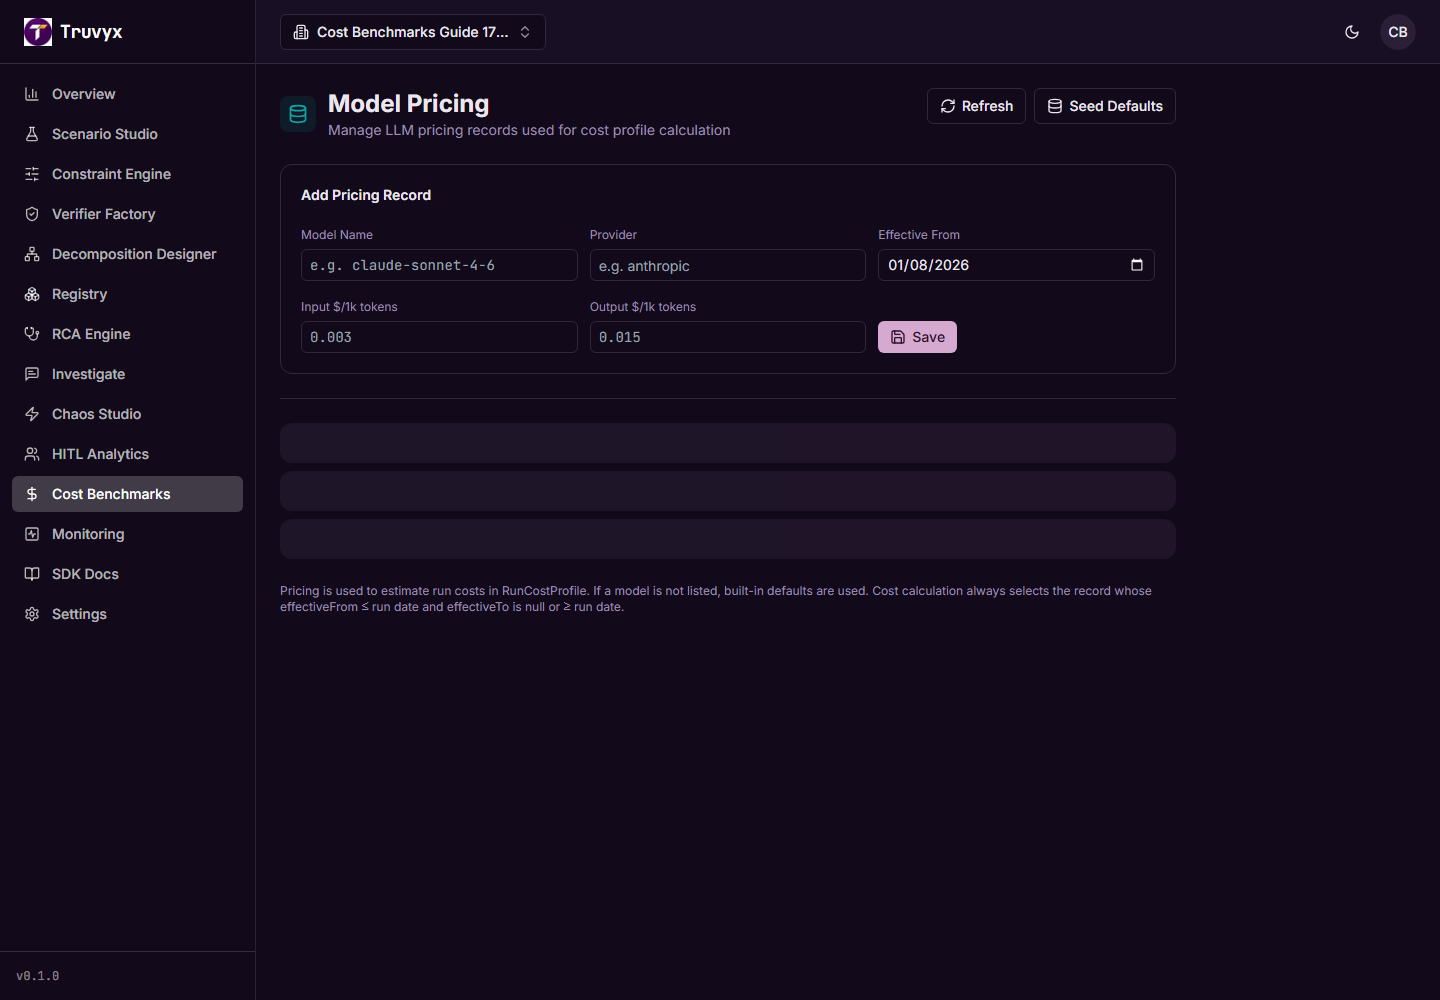
The table records:
- Model: the exact model identifier found in the trace.
- Provider: the vendor associated with that model.
- Input $/1k: the price for 1,000 input tokens.
- Output $/1k: the price for 1,000 output tokens.
- Effective From/To: the period during which that price applies.
Step 2: seed, add, edit, or refresh pricing
Click Seed Defaults to load built-in records. The defaults include Anthropic Claude, OpenAI GPT, Google Gemini, DeepSeek, and Mistral examples. Use Add Pricing Record when your trace uses a model that is not listed.
Enter the exact model name, provider, input and output prices, and effective date. Click Save. To change an existing record, click Edit, update the provider or rates, and click Update. Refresh reloads the table from the database.
Delete only a record that is genuinely wrong or obsolete. For historical reproducibility, an effective date range is safer than rewriting the meaning of an old price.
The pricing page is administrative configuration, not a live provider billing feed. Verify rates and effective dates against your provider contract before using the numbers for financial commitments.
Step 3: know how a run cost is calculated
For every traced agent, Truvyx selects pricing using the model name and run date. It first looks for a database record whose effective period includes the run. If none exists, it uses a built-in fallback for known models. An unknown model is marked unpriced rather than being assigned a made-up rate.
The estimate is straightforward:
Truvyx sums each agent’s cost to produce total input tokens, output tokens, total tokens, API calls, tool calls, average call latency, and estimated USD cost. It also keeps a per-agent breakdown so a multi-agent workflow’s expensive component is visible.
Step 4: calculate the Cost & Efficiency tab
Open an Evaluation Run and select Cost & Efficiency. If the run has no profile yet, click Calculate Cost Profile. Truvyx reads the trace, calculates the profile, and stores it against that run.
The tab reports:
- Total Cost: estimated cost of the traced calls.
- Tokens: input, output, and combined token usage.
- API/Tool Calls: how many model and tool calls occurred.
- Redundant Calls: calls identified as duplicate prompts, unnecessary refetches, verification loops, or recovery spirals.
- Cost per Correct Decision: total cost divided by the number of passing score dimensions.
- Tokens per Constraint Satisfied: combined tokens divided by satisfied constraints where available.
- Efficiency Percentile: comparison with other runs of the same scenario.
Step 5: interpret redundancy as a diagnosis signal
A redundant call is not automatically a bug. A retry after a transient 503 may be correct. The signal becomes important when the same prompt is repeated without new information, a tool is refetched unnecessarily, verification loops forever, or the system calls a recovery path for a hallucinated dependency.
Redundant calls increase tokens, API cost, and latency. When the calculator finds them, it can propagate OPTIMIZATION_FAILURE events into an existing RCA report. Follow the evidence in RCA Engine before changing prompts or models.
Example: if the diagnostics agent costs twice as much as the planner because it repeats the same retrieval three times, test caching, context boundaries, and stop conditions. Do not simply move the diagnostics agent to a cheaper model if the repeated work is architectural.
Step 6: compare runs fairly
Scenario cost benchmarks calculate average, minimum, maximum, p50, and p90 cost across up to 100 recent profiles for the same scenario. Cost comparison can sort profiles by estimated cost and include token totals, calls, redundancy, cost per decision, latency, efficiency percentile, and per-agent breakdown.
Compare like with like: same scenario version, same hard constraints, similar success criteria, and comparable workload. A cheap run that skipped a required verification step should not beat a more expensive run that produced a valid, safe result.
For a release decision, report cost beside feasibility, completeness, optimality, violations, and resiliency. Efficiency is one dimension of system quality, not permission to weaken a safety boundary.
How Cost Benchmarks connects to the platform
- Scenario Studio: defines the workflow and constraints used to judge cost per correct decision.
- Verifier Factory: produces the passing and violation evidence behind efficiency metrics.
- RCA Engine: investigates redundant-call optimization failures.
- Chaos Studio: tests whether added latency or dependency faults create expensive recovery loops.
- Registry leaderboard: exposes correctness, efficiency, combined value, and cost/run for public benchmark comparisons.
- Monitoring: watches for cost and latency regressions after a model, prompt, or orchestration change.
A safe first cost analysis
- Seed or verify the model pricing records.
- Submit one run with agent call traces and token usage.
- Calculate its Cost & Efficiency profile.
- Review the per-agent cost and redundant-call count.
- Compare it with other runs of the same scenario.
- Investigate one expensive or redundant path in RCA.
- Rerun after the change and compare both quality and cost.
Continue the workflow
Use the RCA Engine guide when cost evidence points to repeated calls, verification loops, or optimization failures.