
RCA Engine · Beginner tutorial
How to investigate an AI failure with Truvyx RCA Engine
A failed evaluation tells you that something went wrong. Root Cause Analysis helps you understand what happened, which fault started the chain, what evidence supports that conclusion, and what smallest change is worth testing next. This guide starts from a run and follows the investigation to a reusable remediation plan.
RCA is not another pass/fail score
The Verifier answers “did this output satisfy the scenario?” RCA asks “why did the system produce this result?” It uses the evaluation run, violations, scenario context, verifier information, and—when available—an execution trace. The result is a diagnosis with uncertainty, not a magical claim of certainty.
Before you begin: collect the right evidence
RCA starts from an Evaluation Run. A useful run includes the scenario ID, the name of the system, the raw agent output, verifier status, constraint violations, and environment or trace data where your integration supports it.
If you only submit a final answer, RCA can still reason from violations and output, but it may not be able to distinguish a bad plan from a bad handoff or a tool failure. For multi-agent systems, capture step order, agent IDs, input/output boundaries, tool calls, timestamps, and versioned handoffs.
This is where the earlier modules connect: Constraint Engine supplies the rules, Verifier Factory records violations, and RCA turns that evidence into a causal investigation.
Step 1: open the RCA Engine dashboard
Choose RCA Engine in the dashboard. This opens the Cross-Run Pattern Dashboard, not a single report. It looks across your evaluation history for recurring fault types and systemic weaknesses.
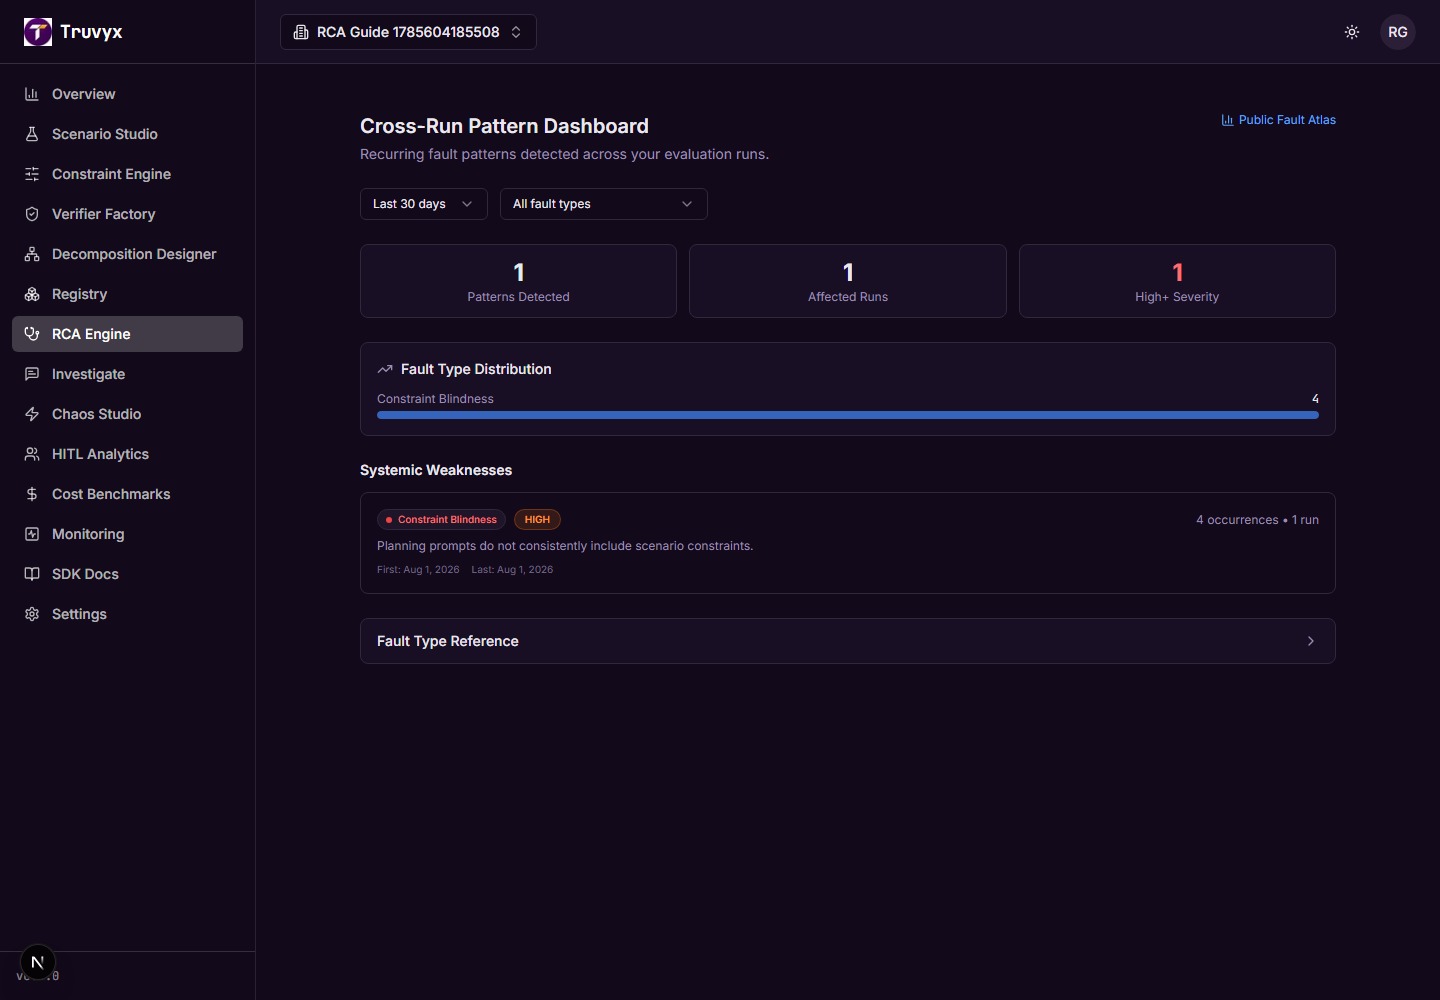
Use the time selector for the last 30, 60, or 90 days. Use the fault-type selector when you want to isolate a category such as Constraint Blindness or Temporal Misalignment. The summary cards show patterns detected, affected runs, and High-or-Critical patterns.
Patterns are not expected after one isolated failure. The dashboard explains that a pattern normally appears after three or more runs share a fault type. That threshold prevents one noisy run from being treated as a systemic problem.
Step 2: understand the fault taxonomy
Open Fault Type Reference at the bottom of the dashboard or report. Each category has a definition, example, and subtypes. The taxonomy gives your team a shared language for discussing failures:
- Decomposition Fault: the task was split or assigned incorrectly.
- Constraint Blindness: an agent could not see or did not check a rule.
- Coordination Breakdown: agents used stale or conflicting shared state.
- Optimization Failure: the result was valid but materially inefficient.
- Hallucinated Dependency: the agent invented a rule, approval, fact, or prerequisite.
- Information Boundary Violation: the agent used data outside its permitted boundary.
- Temporal Misalignment: the system acted in the wrong order or used stale state.
- Contract Violation: an agent-to-agent interface broke.
Do not confuse a fault type with a person or team. “Constraint Blindness” describes a failure in the system’s information and checking path; it does not automatically prove that one prompt author made a mistake.
Step 3: open a single run’s investigation
Open a run from Evaluation Runs and choose Root Cause Analysis. The report page has a back arrow to the run, the scenario name, and two important controls: Run RCA Analysis when no report exists, and Export JSON after the report completes.
On a new run you will see No RCA report yet. Click Run RCA Analysis to begin the six-stage diagnostic pipeline. If the worker is unavailable, the report can move to Failed; restart or repair the worker, then use the retry control.
A live deployment must send RCA jobs to a reachable worker service. A worker URL pointing to localhost works only when the web process and worker share that machine. In production, configure a reachable worker or queue endpoint.
Step 4: follow the analysis stages
While the report is processing, the status tracker polls the RCA status endpoint and marks each stage as pending, active, or complete:
- Trace Processing: normalises execution evidence and the run context.
- Fault Classification: maps observed problems to the fault taxonomy.
- Causal Chain + Counterfactuals: links upstream events to downstream effects and proposes minimal interventions.
- Pattern Analysis: checks the run against recurring weaknesses in your history.
- Report Generation: writes the summary, confidence, faults, fixes, and remediation plan.
- Complete: makes the report available for review and JSON export.
The estimates shown in the tracker are guides, not a service-level guarantee. If the tracker stays still, inspect worker health, Redis/broker reachability, and the worker logs.
Step 5: read the completed report from top to bottom
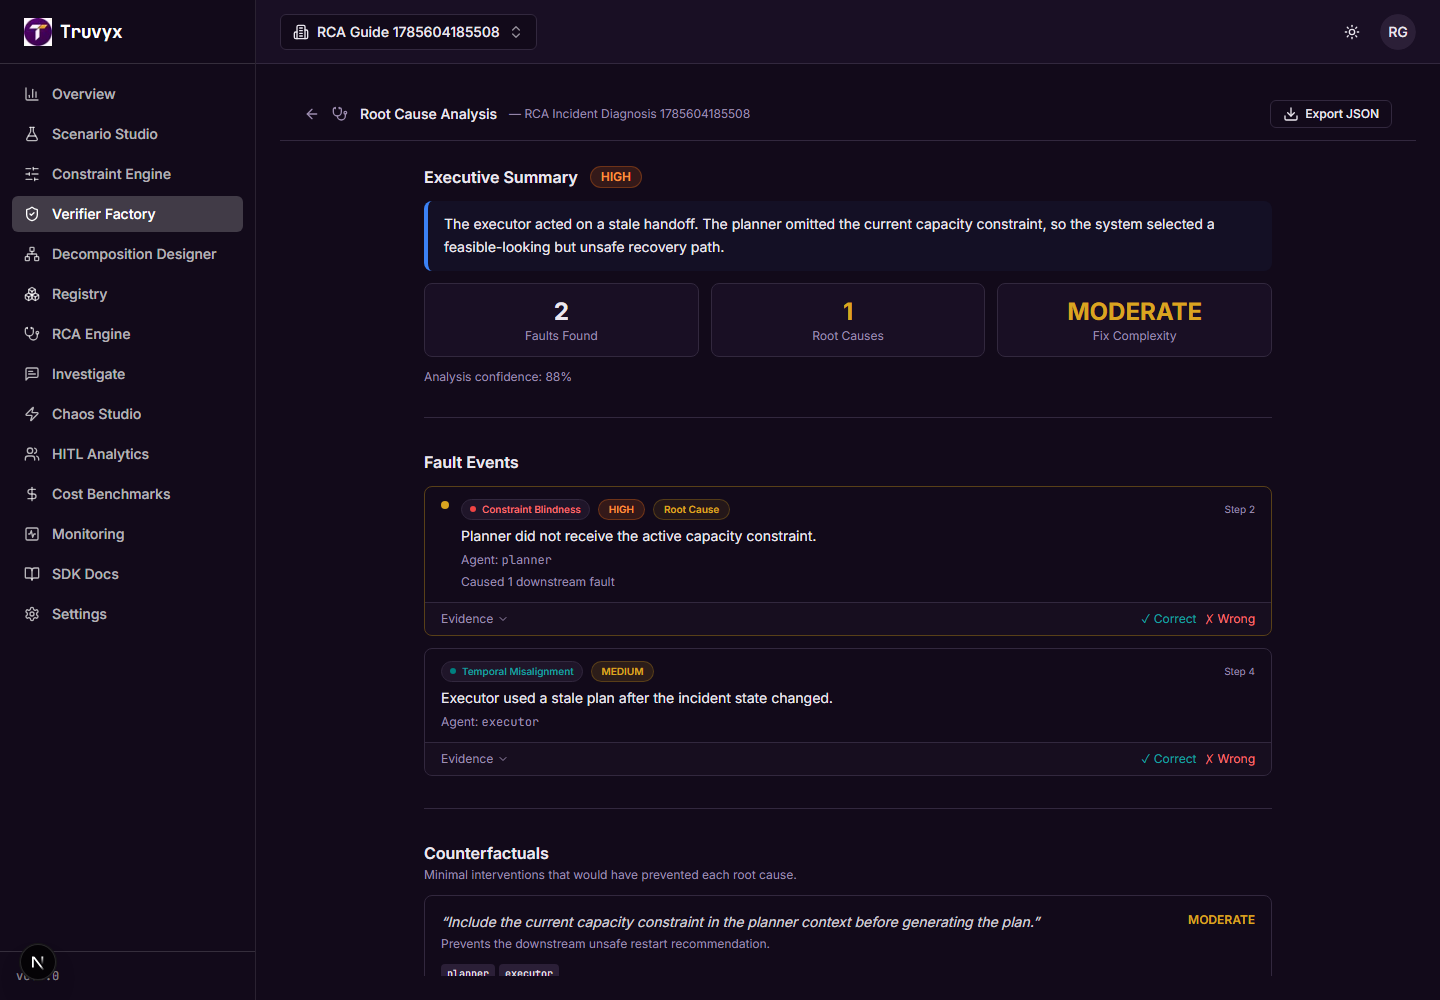
- Executive Summary: read the plain-language explanation, overall severity, faults found, root causes, fix complexity, and confidence score.
- Fault Events: inspect each event’s type, severity, execution step, agent, and downstream effects.
- Evidence: expand the Evidence control to view the structured evidence behind the classification.
- Root Cause label: treat the amber Root Cause marker as the event the analysis believes sits upstream of other faults.
Suppose a planner does not receive the current capacity limit. The executor may then recommend an unsafe restart. RCA should show Constraint Blindness at the planner step, Temporal Misalignment or another downstream fault at the executor step, and a causal relationship between them. Fixing the executor wording alone may hide the symptom while leaving the missing constraint in place.
Step 6: test counterfactuals instead of guessing
The Counterfactuals section proposes minimal interventions that might have prevented each root cause. Each card can show the intervention, estimated impact, affected agents, and complexity: Minimal, Moderate, Significant, or Major.
A counterfactual is a hypothesis. Apply the change in your scenario, rerun the same evaluation, and compare the new evidence. Then click Mark as Applied only when the intervention has actually been implemented or verified by a rerun. Do not mark it merely because it sounds plausible.
Change only the planner’s context so it receives the missing constraint. Keep the model, scenario, and agent output protocol constant. If the downstream violation disappears, you have stronger evidence that the missing constraint was causal.
Step 7: use feedback and remediation
For each fault, choose ✓ Correct if the classification is useful or ✗ Wrong if it needs review. Feedback is important because automated diagnosis can be uncertain or misleading when traces are incomplete.
The Remediation Plan is an ordered checklist. Each step includes an owner, effort, description, priority, and verification method. Check items as your team completes them, then use the stated verification method to create a new run rather than relying on a manual claim that the problem is fixed.
Export the completed report as JSON when you need to attach the diagnosis to an incident, issue tracker, audit record, or engineering review.
How RCA connects to the next module
- Constraint Engine: add or expose the rule that the root-cause event could not see.
- Decomposition Designer: repair wrong boundaries, assignments, missing subtasks, or coordination contracts.
- Verifier Factory: encode the proposed repair as an executable check.
- Evaluation Runs: rerun the same case and compare evidence before and after the change.
- Monitoring: watch whether the fault returns across later runs.
- Registry: publish a hardened scenario or versioned benchmark when the evaluation becomes reusable.
A safe first investigation
- Choose one failed run with a clear violation.
- Capture or attach the execution trace if your system is multi-agent.
- Run RCA and wait for the status tracker to complete.
- Read the summary, then expand evidence for every root-cause candidate.
- Choose one counterfactual and change only that variable.
- Rerun the scenario through the Verifier Factory.
- Compare the new run, update the remediation checklist, and monitor for recurrence.
Continue the workflow
Read the Decomposition Designer guide when the RCA points to orchestration, handoff, or agent-boundary problems.