
Monitoring · Beginner tutorial
How to monitor AI regressions after deployment
Monitoring watches what happens after release, when real traffic, provider changes, new data, and long-running workflows create conditions your pre-deployment suite cannot fully predict. Truvyx Monitoring samples completed runs, compares them with baselines, detects score and fault drift, and routes alerts to the people who need to investigate.
Monitoring is a feedback loop, not a launch certificate
A passing release proves what was observed before launch. Monitoring checks whether the same quality continues. When a window drifts, the correct response is to inspect the evidence, determine whether the change is expected, and either resolve the alert or send it into RCA and remediation.
Before you begin: produce completed runs
Monitoring is fed from completed Evaluation Runs. Your runs need scores that expose feasibility, completeness, and optimality where possible, plus violations so high-severity fault rate can be calculated. The run-completion pipeline checks active tracked patterns and sampling configurations.
Start with a stable scenario and a known-good baseline. The Scenario Studio guide explains how to author the scenario; Verifier Factory explains how the scores and violations are produced.
Step 1: open Monitoring and read the overview
Open Monitoring from the dashboard. The top summary shows active configurations, open alerts, and trend counts. Use the configuration selector to view all monitoring suites or focus on one.
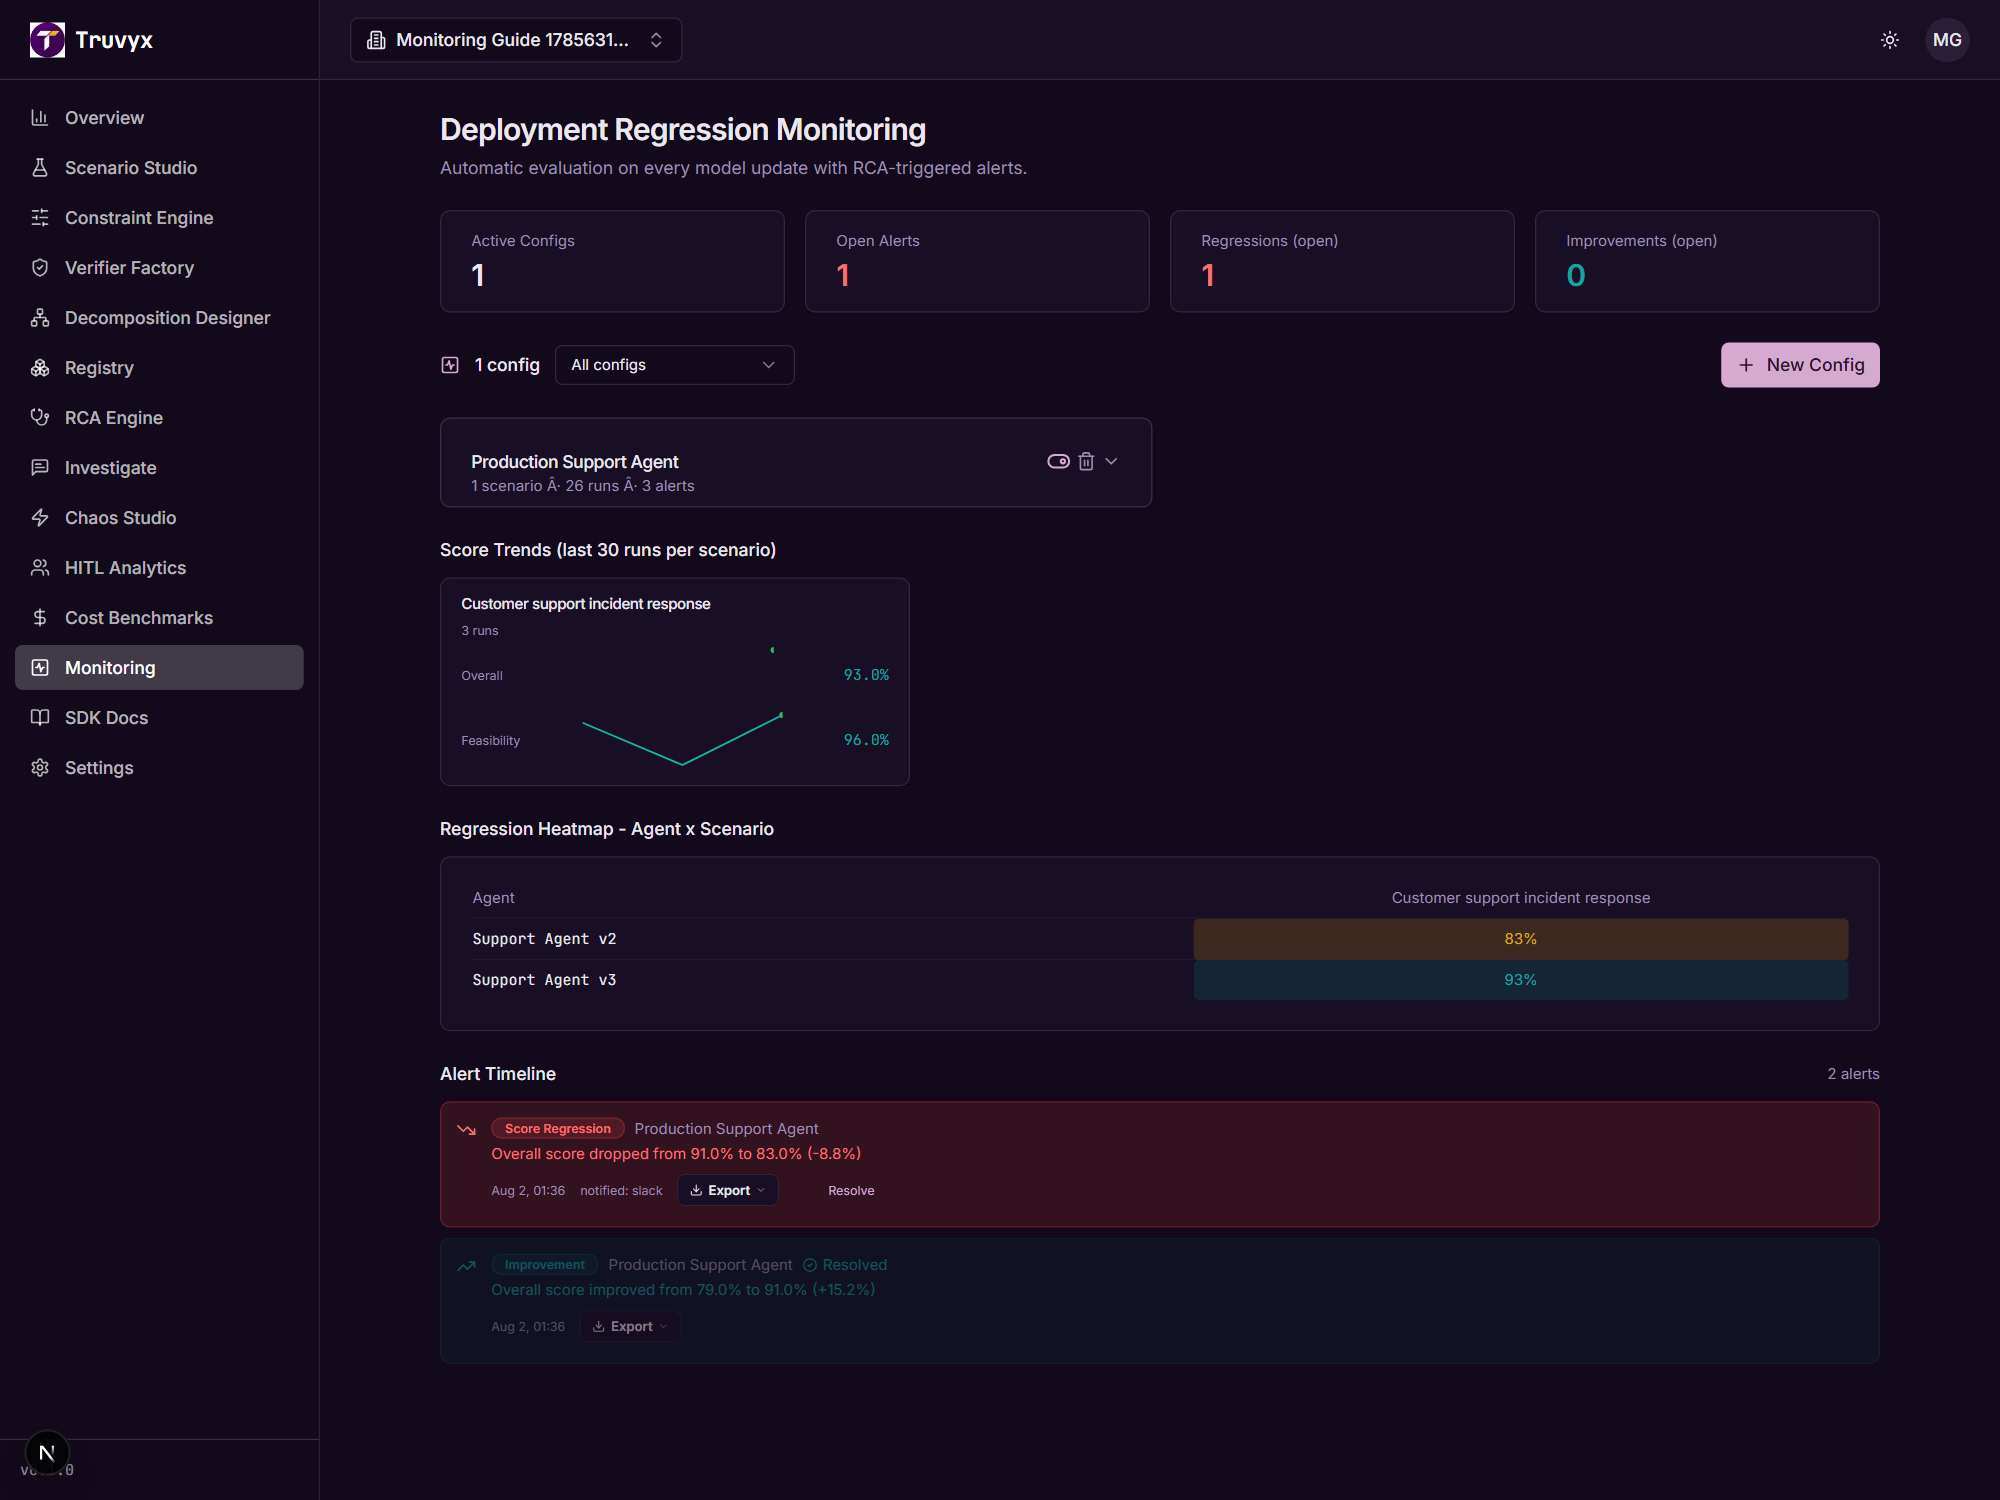
The page is organised into four sections:
- Configurations: what suites are active and how many runs/alerts they contain.
- Score Trends: recent overall, feasibility, completeness, and optimality lines per scenario.
- Regression Heatmap: the latest overall score for each agent-system and scenario combination.
- Alert Timeline: open and resolved changes that need review.
Step 2: create a monitoring configuration
Click New Config. Give the configuration a name and select one or more scenarios as a suite.
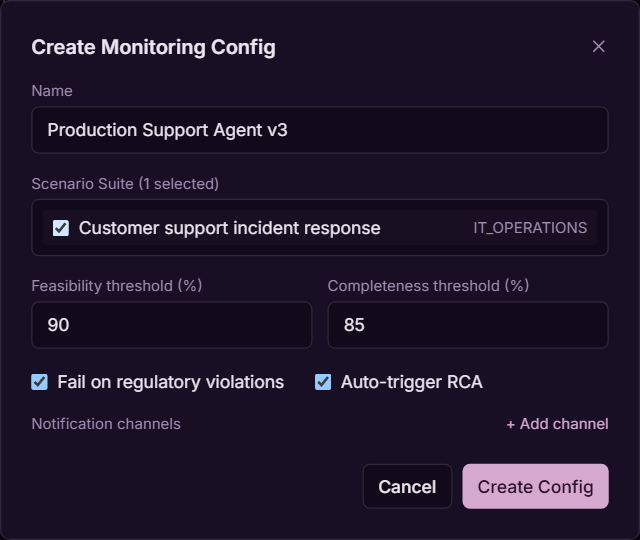
Configure:
- Feasibility threshold: the minimum acceptable feasibility score.
- Completeness threshold: the minimum acceptable completeness score.
- Fail on regulatory violations: create a critical alert for critical regulatory constraint violations.
- Auto-trigger RCA: automatically start root-cause analysis when the configured regression path fires.
- Notification channels: Slack, email, or PagerDuty configuration.
Choose thresholds from a reviewed baseline. A threshold that is too close to ordinary run variance creates alert fatigue; one that is too low turns a safety control into decoration.
Step 3: understand how sampling works
Continuous sampling does not necessarily process every production run. A sampling configuration can use a rate, strategy, window duration, and minimum samples per window. RANDOM and STRATIFIED currently use uniform probability; HIGH_STAKES_WEIGHTED increases the chance of sampling decisions with higher stakes.
Sampled run IDs accumulate in an open time window. When the window closes, Truvyx computes average feasibility, completeness, optimality, and fault rate. If the window has fewer than the minimum samples, it is marked insufficient rather than producing a misleading trend.
Sampling is a tradeoff: higher coverage gives faster signal and greater cost; lower coverage reduces overhead but delays confidence. High-risk workflows deserve a higher rate or high-stakes weighting.
Step 4: establish and interpret a baseline
A baseline stores expected average feasibility, completeness, optimality, and fault rate. You can establish it from selected baseline run IDs or allow Monitoring to use the last computed window when enough data exists.
When a window is computed, Monitoring compares the weighted current overall score with the weighted baseline:
It also compares current high/critical fault rate with the baseline. If score drift exceeds the configured drift threshold or fault-rate change exceeds its threshold, the window is marked degrading and drift alerts are dispatched. Improvement and stable directions are recorded too.
Step 5: read the trend lines and heatmap
Score Trends show recent runs by scenario. Look for a step change after a model, prompt, tool, policy, or provider change; a slow decline can indicate silent model or data drift. The Regression Heatmap makes the comparison easier when several agent systems share a scenario.
Cells are teal at 90% and above, amber from 75% to below 90%, and red below 75%. The heatmap uses the latest score for each agent/system and scenario pair, so open the underlying runs before making a release decision.
Combine trend evidence with Investigate when you want to ask how often the same fault has appeared, and with Cost Benchmarks when a regression is accompanied by a cost or latency increase.
Step 6: triage the alert timeline
Alerts are classified as Score Regression, Threshold Breach, Regulatory Violation, New Fault Type, or Improvement. Each alert includes the configuration, message, score delta when available, notification channels, creation time, and resolution state.
Use Resolve only after reviewing the linked run and deciding what the alert means. A resolved badge records that the alert was handled; it does not rewrite the run or prove the system is fixed.
Export an alert or report when you need to attach the evidence to an incident, release review, or audit record. For a score regression, follow the run into RCA Engine. For a regulatory violation, inspect the originating Constraint Engine rule first.
Step 7: manage the configuration safely
Each config card shows active state, scenario count, run count, and alert count. Expand it to review thresholds, regulatory behavior, Auto-RCA, notification types, and the trigger endpoint information. Use the toggle to deactivate a config temporarily; delete only when the configuration is no longer part of your operating model.
For external run pipelines, the Monitoring trigger endpoint accepts an API key and config ID. Keep the key in a secret manager. Do not paste webhook URLs, PagerDuty keys, or API keys into screenshots, logs, or public documentation.
How Monitoring connects to the platform
- Evaluation Runs: provide the scores, violations, and sampled observations.
- RCA Engine: investigates score regressions and can be triggered automatically.
- Constraint Engine: supplies feasibility, completeness, and regulatory rules.
- Cost Benchmarks: reveals whether a quality change also changed token cost, latency, or redundancy.
- Investigate: provides grounded questions over repeated faults and tracked patterns.
- HITL Analytics: shows whether human edits, rejections, or escalations change after a regression.
A safe first monitoring setup
- Choose one stable, high-value scenario.
- Run enough known-good evaluations to establish a baseline.
- Create a config with reviewed feasibility and completeness thresholds.
- Enable regulatory blocking and Auto-RCA for high-risk workflows.
- Start with one notification channel and verify it receives a test alert.
- Review the first closed sampling window for sufficient data.
- Investigate every degrading alert before resolving it.
- After a fix, compare the next window with the same baseline and document the result.
Continue the workflow
When Monitoring finds a regression, use the RCA Engine guide to move from alert to root cause and verified repair.